Upload date
All time
Last hour
Today
This week
This month
This year
Type
All
Video
Channel
Playlist
Movie
Duration
Short (< 4 minutes)
Medium (4-20 minutes)
Long (> 20 minutes)
Sort by
Relevance
Rating
View count
Features
HD
Subtitles/CC
Creative Commons
3D
Live
4K
360°
VR180
HDR
2,873 results
... we want to transform or stretch them to reveal different things about the data. And we can do that in ggplot using various forms of ...
343 views
5 years ago
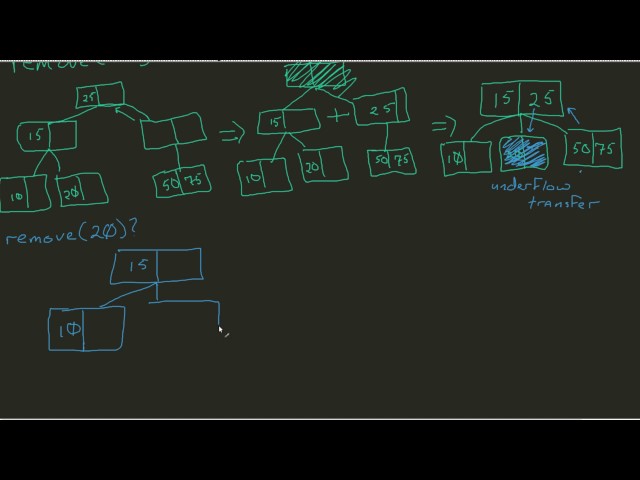
- So now that I've built out that structure, and I've got my all my elements from the previous video, just blown up a little bit. Let's say ...
580 views
8 years ago
1,955 views
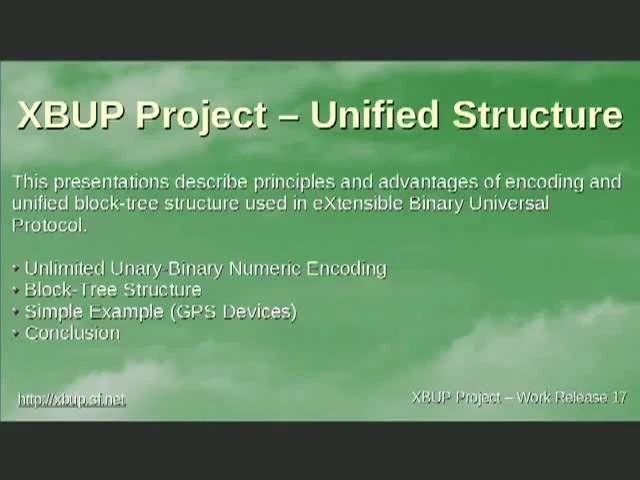
This is short presentation for the XBUP Project describing some fundamental techniques and advantages of unified structure.
136 views
16 years ago
Programming tutorials are a pervasive, versatile medium for teaching programming. In this paper, we report on the content and ...
347 views
Coding – computer programming or hacking – is one of the central elements of data science. This overview presents the main ...
927 views
... 10 questions, five questions to always have the same data structure for all of the different, different surveys that we received.
133 views
4 years ago
527 views
1,539 views
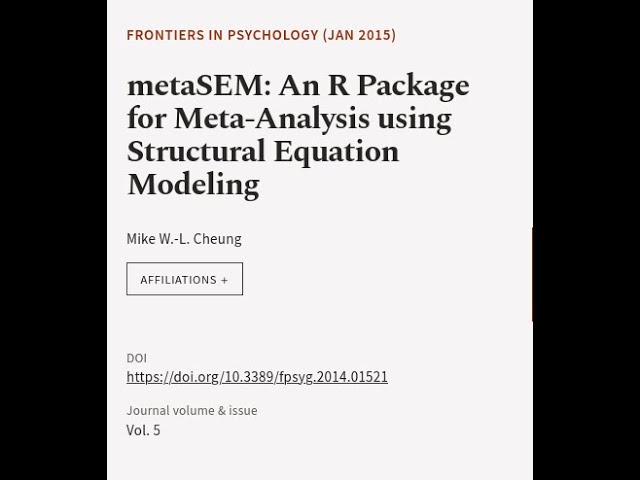
Keywords ### #Metaanalysis #StructuralEquationModeling #r #metaSEM #Metaanalyticstructuralequationmodeling #RTCLTV ...
17 views
1 year ago
Show how to do standardization properly in moderated regression, using the std_selected_boot() function from the R package ...
32 views
2 years ago
Mastering Data Normalization - Power Query Challenge 35 In this Power Query challenge, we tackle the task of normalizing a ...
571 views
19 views
[no audio] And to fill in the placeholders, we take the members of our data structure. item.weight, item.serving_size, and item.price.
221 views
The R Programming language is a free and open-source tool for statistical computing and graphics. In this video, you will learn ...
52 views
6 months ago
DataLad can do many things, but this video explains what is at the core of it.
2,313 views
Video from http://www.cdf.toronto.edu/~heap/racket_lectures.html on how to use structs to create an aggregate with named parts.
2,848 views
12 years ago
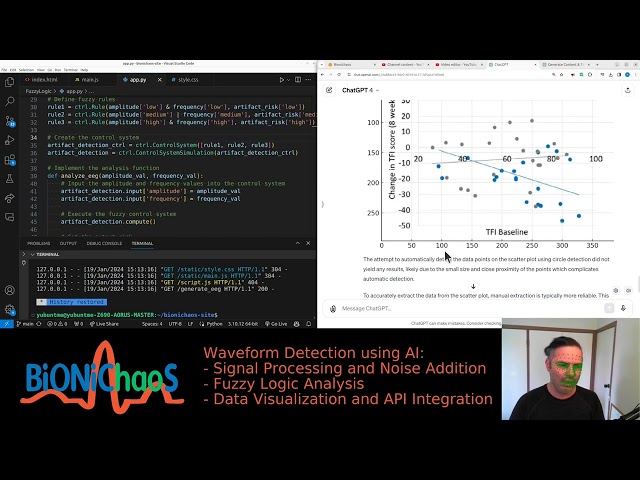
In this video, I share my experience with GPT-4 extracting data from a challenging paper. I attempted to use Matplotlib and Numpy ...
96 views
In this mini series, Surma introduces you to the various functional methods that JavaScript Arrays have to offer. In this episode: ...
10,117 views
7 years ago
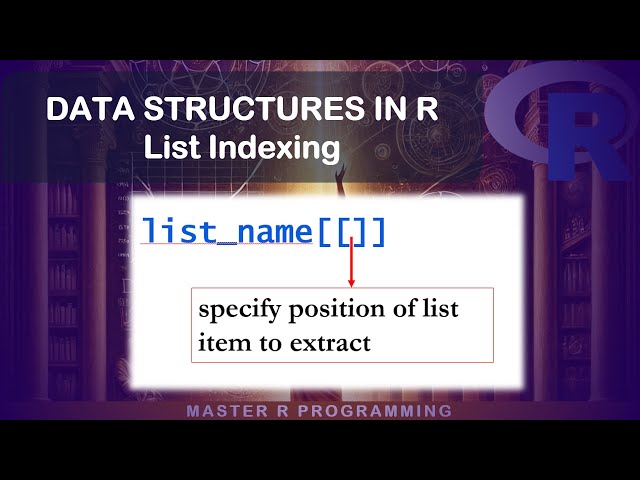
Learn how to create and use lists in R, which are dynamic, flexible R objects that can hold and organize other R objects.
19,747 views