Upload date
All time
Last hour
Today
This week
This month
This year
Type
All
Video
Channel
Playlist
Movie
Duration
Short (< 4 minutes)
Medium (4-20 minutes)
Long (> 20 minutes)
Sort by
Relevance
Rating
View count
Features
HD
Subtitles/CC
Creative Commons
3D
Live
4K
360°
VR180
HDR
42,539 results
Welcome to our comprehensive tutorial on **Python PANDAS for Beginners**! In this video, we will dive into the powerful world of ...
103,018 views
1 year ago
In this video, we dive deep into the world of data visualization in Python using three powerful libraries: Matplotlib, Seaborn, and ...
3,612 views
Using Ellipse and Shape Builder create Data Visualization Graph in Adobe Illustrator Adobe Illustrator Tutorial Graphic Designer ...
2,550 views
7 months ago
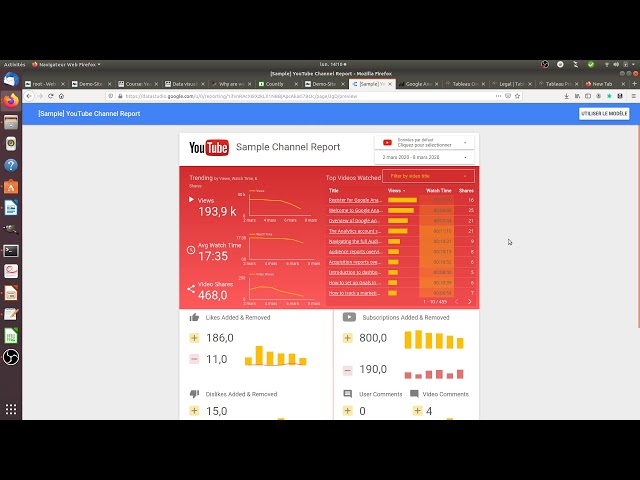
Data visualisation is the most effective way to communicate marketing data in a form that others can understand and act upon.
330 views
4 years ago
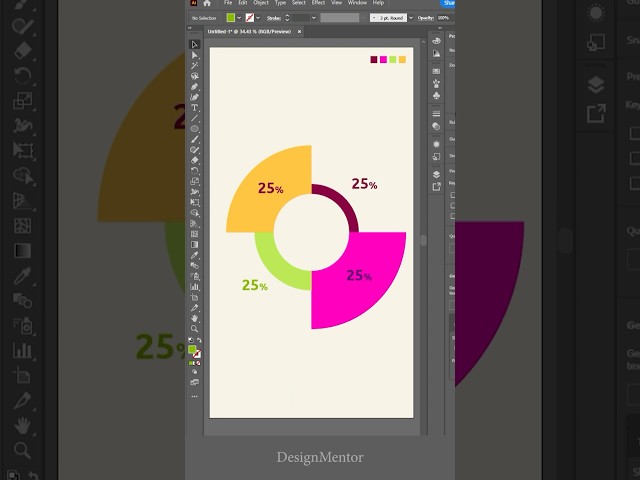
Create Data Visualization Chart in Adobe Illustrator | DesignMentor Adobe Illustrator Tutorial Graphic Designer UX Designer User ...
1,551 views
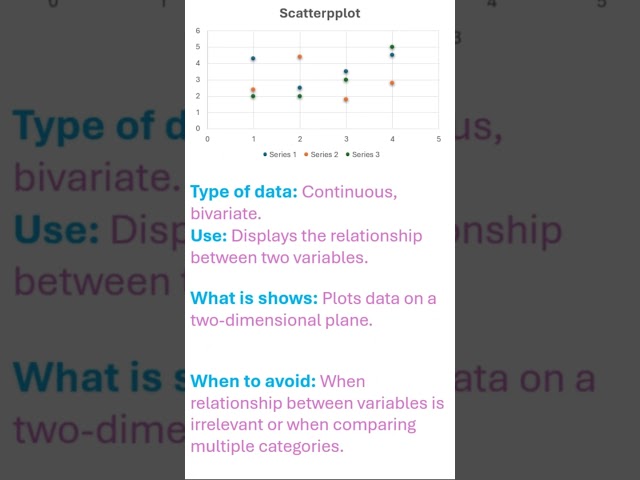
Chart Champoins: Data Visualization Done Right! - Scatterplot #Lean #leadership #Kaizen #TPM #CI ...
11 views
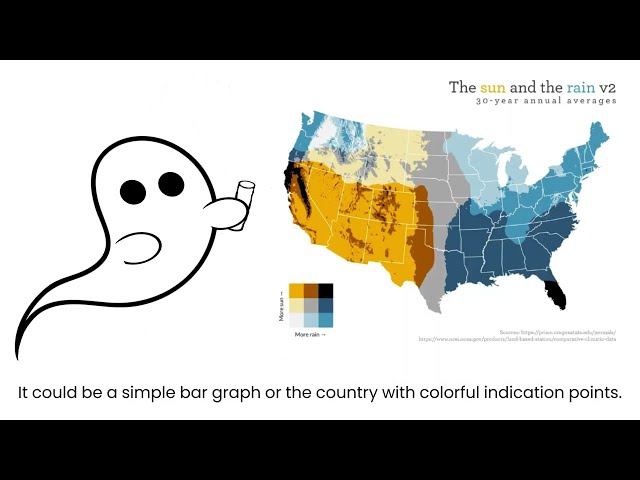
When you have a lot of information the best way to show it is with a cool graphic! Data visualization is an awesome blend of ...
53 views
3 years ago
Please, consider subscribing to our channel, it helps us spread the word about Free software and digital marketing. This video ...
241 views
5 years ago
Don't train your model without visualizing first! #MachineLearning #PythonTips #DataVisualization #Matplotlib #MLTraining ...
194 views
4 months ago
Welcome to ML Explained – your ultimate resource for mastering Machine Learning, AI, and Software Engineering! What We ...
89,302 views
#DataAnalysis #SQL #ExcelTips #Tableau #DataVisualization #BeginnerProjects #DataScience #DataJourney #KnowlyticsLab ...
70 views
Let's talk about Data Visualization! We've been hearing this expression a lot lately, but do you really know how to put your data in ...
179 views
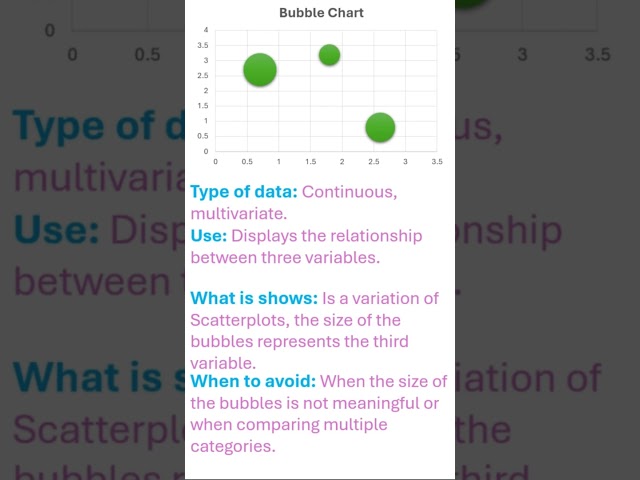
Chart Champoins: Data Visualization Done Right! - Bubble Chart #Lean #leadership #Kaizen #TPM #CI ...
83 views
Dive into the world of data visualization with this comprehensive guide to mastering Matplotlib in Python! In this tutorial, we'll ...
57 views
Embarking on data visualization is exciting, especially with a clear purpose. Setting objectives ensures your visualizations ...
14 views
Please, consider subscribing to our channel, it helps us spread the word about Free software and digital marketing. The standard ...
21 views
To dynamically changed styles, we can use a function as the value argument in the style method, which can take in an item from ...
866 views
To view the full course, please visit: pluralsight.pxf.io/data-viz-r-1.
84 views
8 years ago
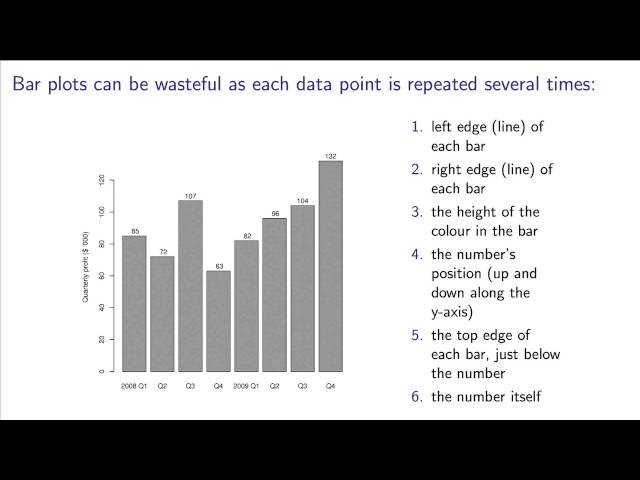
These videos are part of the FREE online book, "Process Improvement using Data", http://yint.org/pid Related is the Coursera ...
3,756 views
11 years ago
The Matplotlib figure canvas renderer can be confusing to wrestle with if you don't know how it actually works. By the end of this ...
9,628 views


![Don’t Train Without This Step! Visualize Your Data in Python [3]](/api/proxy/image?url=https%3A%2F%2Fi.ytimg.com%2Fvi%2FLEQAxM_qeM4%2Fsddefault.jpg)