Upload date
All time
Last hour
Today
This week
This month
This year
Type
All
Video
Channel
Playlist
Movie
Duration
Short (< 4 minutes)
Medium (4-20 minutes)
Long (> 20 minutes)
Sort by
Relevance
Rating
View count
Features
HD
Subtitles/CC
Creative Commons
3D
Live
4K
360°
VR180
HDR
5,153 results
Discover 5 different ways to debug your code beyond console.log - Discover the breakpoints, debugger statements, logpoints, ...
46,136 views
2 years ago
Learn how to inspect and debug various Storage APIs using the Application panel in Chrome DevTools. Matthias shares how to ...
3,288 views
1 month ago
In this video, we dive into the world of Android Instant Apps, exploring the unique challenges developers face when debugging ...
11 views
1 year ago
Help us caption & translate this video! http://amara.org/v/61Si/
1,533 views
10 years ago
Tips on debugging CSS Flexbox with Chrome DevTools. Chapters: 0:00 - Intro 0:08 - Flexbox editor 0:49 - Flex badge and overlay ...
25,749 views
4 years ago
Learn about the different functions for debugging in MATLAB.
98 views
5 years ago
In this video, we delve into the essential techniques for debugging shared libraries with debug information. Whether you're a ...
1 view
7 months ago
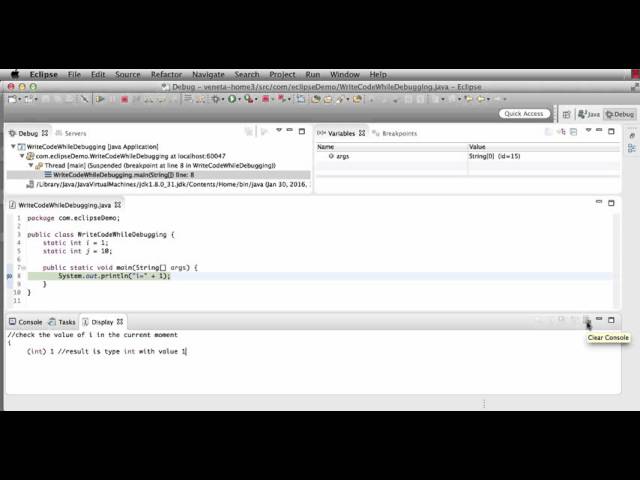
http://nikolay-totomanov.com/2016/01/30/write-code-while-debugging/ Steps: 1. Add 'BreakPoint' - double click or Right-click 2.
77 views
https://amzn.to/4aLHbLD You're literally one click away from a better setup — grab it now! As an Amazon Associate I earn ...
0 views
Join Matthias and explore how AI assistance in Chrome DevTools streamlines CSS debugging. Discover how to troubleshoot ...
3,058 views
4 months ago
In today's data-driven world, encountering missing datasets can be a frustrating challenge for analysts and data scientists alike.
12 views
5 months ago
If you work with multiple editors, or collaborate with people that use different ones, it can be a pain to change how the debugging ...
528 views
3 years ago
In this video, we dive into the essential techniques for debugging Retrofit API calls, a crucial skill for any Android developer.
3 months ago