ViewTube

ViewTube
Sign inSign upSubscriptions
Filters

Upload date

Type

Duration

Sort by

Features

Reset

3,183 results

Fedora Project
How #Toolbx Solves Debugging

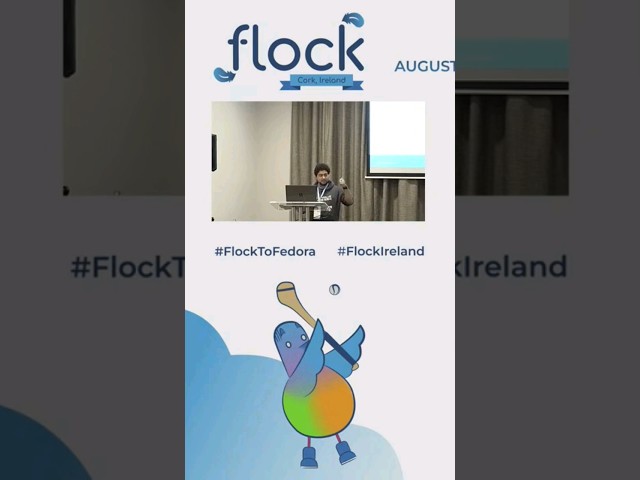
Sumantro Mukherjee from Red Hat shows how Toolbx helps you debug your project, test different use cases and keep your base ...

0:49
How #Toolbx Solves Debugging

188 views

2 years ago

SlickEdit
SlickEdit - How to Debug a Project

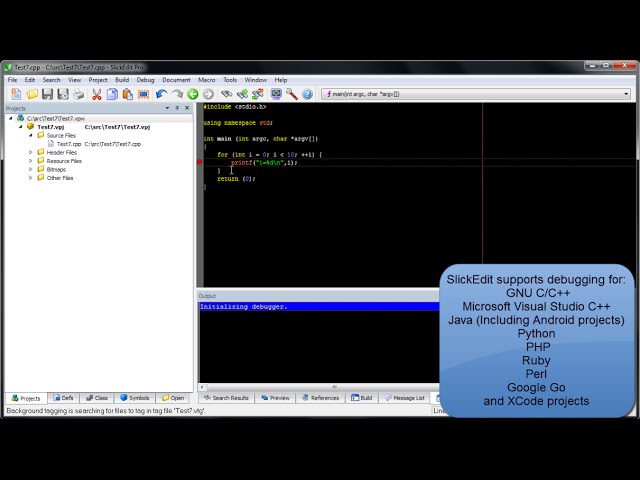
Download a free trial https://www.slickedit.com/ ! How to Debug a Project in SlickEdit.

1:09
SlickEdit - How to Debug a Project

1,249 views

9 years ago

Chrome for Developers
Breakpoints and logpoints #DevToolsTips

Discover 5 different ways to debug your code beyond console.log - Discover the breakpoints, debugger statements, logpoints, ...

3:41
Breakpoints and logpoints #DevToolsTips

45,578 views

2 years ago

Roel Van de Paar
Trying (and failing) to install Debugging Tools for Windows (WinDbg) (2 Solutions!!)

https://amzn.to/4aLHbLD You're literally one click away from a better setup — grab it now! As an Amazon Associate I earn ...

2:44
Trying (and failing) to install Debugging Tools for Windows (WinDbg) (2 Solutions!!)

48 views

5 years ago

Turbo Learn PHP
What’s the quickest way to debug #php code? Master #php Debugging in Seconds The Ultimate Tip!

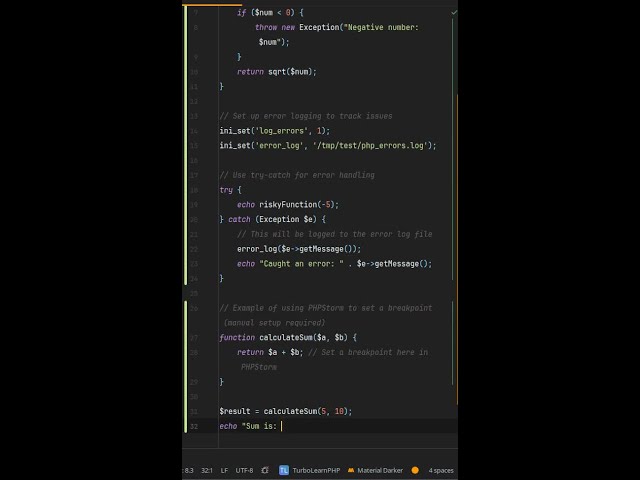
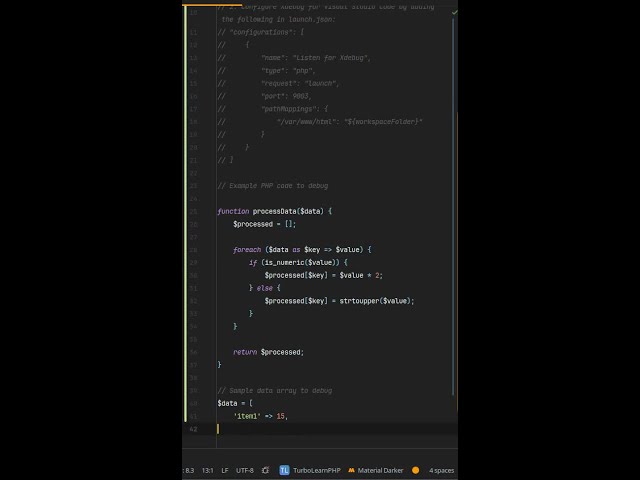
Try using Xdebug for advanced debugging tools. Are you tired of spending hours debugging your PHP code? What if I told you ...

0:17
What’s the quickest way to debug #php code? Master #php Debugging in Seconds The Ultimate Tip!

1,426 views

1 year ago

Chrome for Developers
Debug LCP #DevToolsAI

LCP is short for Largest Contentful Paint. Debug LCP with Performance Insights in the updated Chrome DevTools Performance ...

0:28
Debug LCP #DevToolsAI

36,385,452 views

5 months ago

Addy Osmani
Announcing Chrome DevTools MCP! 🚀 Connect your AI coding agent to Chrome's powerful debugger free

Announcing ChromeDevTools MCP! Connect your AI coding agent to Chrome's powerful automation & debugging capabilities ...

3:35
Announcing Chrome DevTools MCP! 🚀 Connect your AI coding agent to Chrome's powerful debugger free

14,816 views

6 months ago

Chrome for Developers
Chrome DevTools: Streamlined debugging with Gemini

Boost your development workflow with Gemini integrated directly into Chrome DevTools. With AI assistance, you can now get ...

2:01
Chrome DevTools: Streamlined debugging with Gemini

21,261,691 views

10 months ago

Chrome for Developers
Debug speculative navigations

Learn about the Speculation Rules API which can be used to prefetch and prerender future page navigations to greatly improve ...

0:38
Debug speculative navigations

3,426 views

1 year ago

Chrome for Developers
Simplify network debugging with AI Assistance

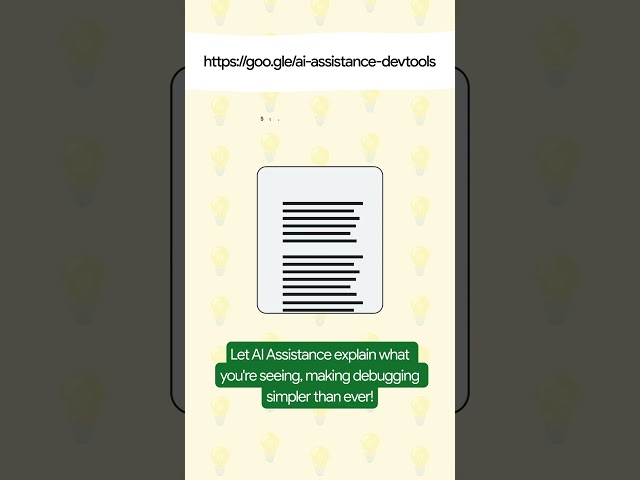
Discover how AI Assistance in DevTools can simplify your debugging process by explaining complex network requests.

0:18
Simplify network debugging with AI Assistance

1,198 views

1 year ago

Roel Van de Paar
Software Engineering: What's better than outputdebugstring for windows debugging? (2 Solutions!!)

https://amzn.to/4aLHbLD You're literally one click away from a better setup — grab it now! As an Amazon Associate I earn ...

1:56
Software Engineering: What's better than outputdebugstring for windows debugging? (2 Solutions!!)

15 views

3 years ago

Turbo Learn PHP
Which debugging tools are best for PHP? #top Debugging Tools for #php Are You Using Them?

Which debugging tools are best for PHP? 🏍️ Xdebug is powerful for step debugging and profiling. 🏍️ BUT it can slow down ...

0:30
Which debugging tools are best for PHP? #top Debugging Tools for #php Are You Using Them?

70 views

1 year ago

Chrome for Developers
3 new ways to customize the DevTools Performance panel (Part 1)

Never lose your place in the Performance panel timeline again. Zoom in and set a breadcrumb to clamp the boundaries of the ...

0:31
3 new ways to customize the DevTools Performance panel (Part 1)

8,654 views

1 year ago

LIT Lab at Harvard Graduate School of Education
FabLearn'20 Best Demo: AR Electronic Debugging Tools: HoloBoard and OsciPen (pres: Iulian Radu)

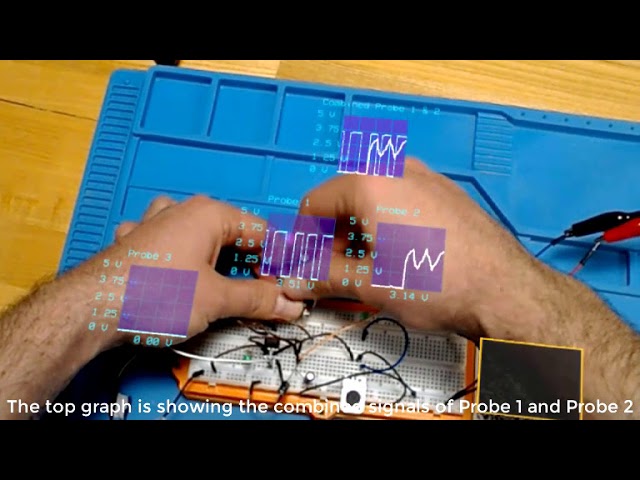
Best Demo Paper @ FabLearn 2020 AUTHORS: Iulian Radu, Caroline Vanderlee, Bertrand Schneider ABSTRACT: Although ...

3:21
FabLearn'20 Best Demo: AR Electronic Debugging Tools: HoloBoard and OsciPen (pres: Iulian Radu)

487 views

5 years ago

Urdhe
How to Use Hover Console: In-Page Debugging with AI-Powered Solutions

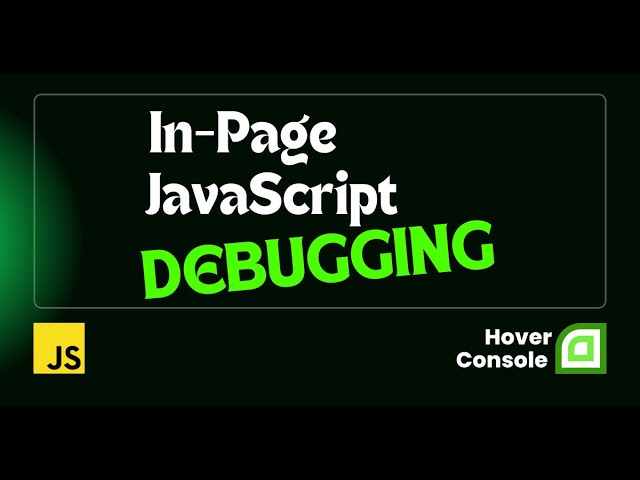
In this video, I'll walk you through the key features of Hover Console, a powerful in-page JavaScript debugging tool designed to ...

1:57
How to Use Hover Console: In-Page Debugging with AI-Powered Solutions

619 views

1 year ago

Chrome for Developers
CSS Flexbox debugging tools #DevToolsTips

Tips on debugging CSS Flexbox with Chrome DevTools. Chapters: 0:00 - Intro 0:08 - Flexbox editor 0:49 - Flex badge and overlay ...

3:56
CSS Flexbox debugging tools #DevToolsTips

25,710 views

4 years ago

Chrome for Developers
Getting started in Chrome DevTools

Jecelyn walks you through the basics of getting started and tips for Chrome DevTools. Watch more DevTools Tips ...

0:38
Getting started in Chrome DevTools

24,116 views

2 years ago

Turbo Learn PHP
Which debugging tools are best for PHP? Best Debugging Tools #php Devs Must Know!

Which debugging tools are best for PHP? 🏍️ Use Xdebug to set breakpoints and inspect variables in real-time. 🏍️ Combine ...

0:30
Which debugging tools are best for PHP? Best Debugging Tools #php Devs Must Know!

95 views

1 year ago

Chrome for Developers
Never debug alone 😴 → 😎 #DevToolsAI

When your teammate's asleep but the code's gotta be fixed! Check out how AI Assistance can help you debug CSS and style ...

0:57
Never debug alone 😴 → 😎 #DevToolsAI

9,980,617 views

1 year ago

WebPlatform Docs
Sample 2: Use IE11 dev tools to debug  — WebPlatform SSO issue with IE11

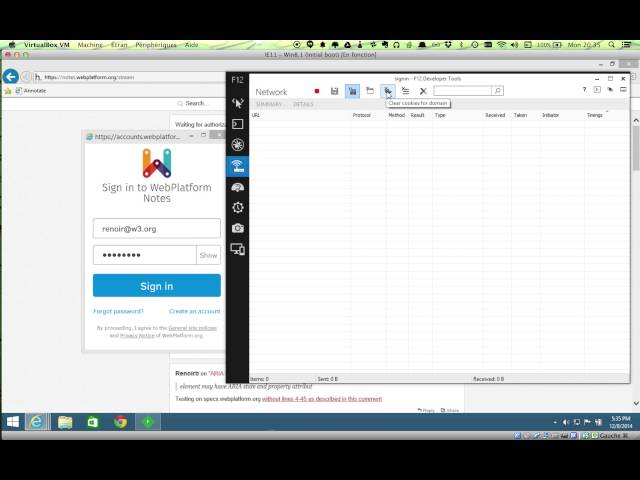
In this scenario, I tried to capture what happened in the browser during signin process. But unfortunately the debug tools window ...

0:55
Sample 2: Use IE11 dev tools to debug — WebPlatform SSO issue with IE11

1,965 views

11 years ago