Upload date
All time
Last hour
Today
This week
This month
This year
Type
All
Video
Channel
Playlist
Movie
Duration
Short (< 4 minutes)
Medium (4-20 minutes)
Long (> 20 minutes)
Sort by
Relevance
Rating
View count
Features
HD
Subtitles/CC
Creative Commons
3D
Live
4K
360°
VR180
HDR
4,079 results
Compute Pearson's r correlation coefficient using SPSS. The interpretation of the output is on a separate video. ASK SPSS ...
32,920 views
12 years ago
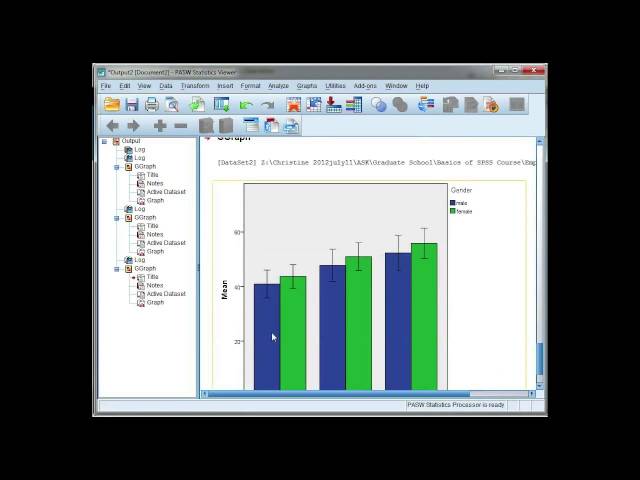
Create a clustered bar or line chart of means for repeated measures data using SPSS. ASK SPSS Tutorial Series.
80,105 views