Upload date
All time
Last hour
Today
This week
This month
This year
Type
All
Video
Channel
Playlist
Movie
Duration
Short (< 4 minutes)
Medium (4-20 minutes)
Long (> 20 minutes)
Sort by
Relevance
Rating
View count
Features
HD
Subtitles/CC
Creative Commons
3D
Live
4K
360°
VR180
HDR
975 results
This is the spotlight presentation video of our NeurIPS 2020 paper 'Uncovering the Topology of Time-Varying fMRI Data using ...
831 views
5 years ago
We implement one of Stata's recently added features that allows you to run Python code from within Stata. Integrating Python can ...
980 views
1 year ago
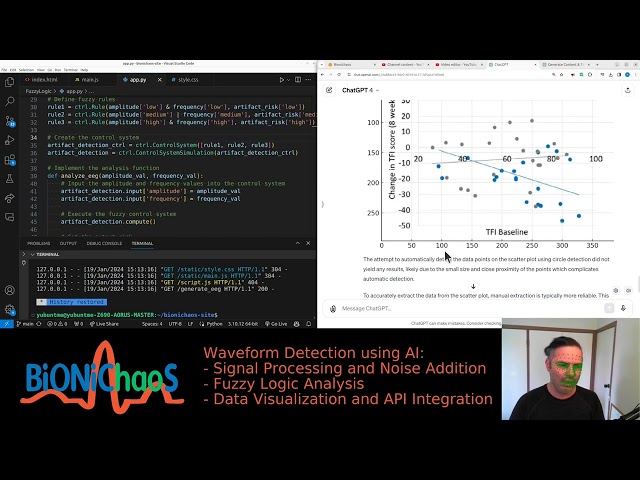
... support my work on https://patreon.com/bionichaos Tags: #dataextraction #matplotlib #numpy #Troubleshooting #dataanalysis.
100 views
2 years ago
python #flask #reportingtool #dataanalytics Stimulsoft Reports.PYTHON comprises a set of components for creating, viewing, ...
112 views
11 months ago
Hi everyone, welcome back to our channel. Today, we're diving deep into the world of data, outlining the best roadmap to ...
118 views
Björklund, A., Mäkelä, J. & Puolamäki, K. (2022). SLISEMAP: Supervised dimensionality reduction through local explanations.
88 views
3 years ago
134 views
10 months ago
Have you ever been given a health data extract that contains just codes, but no display terms? Pathling is your friend! The display ...
78 views
In this video, we explore how to improve Python code for machine learning, focusing on predicting the conductivity of composite ...
41 views
Learn Excel sentiment analysis using AI. No programming or AI knowledge required. Use this with survey or feedback data, ...
15,031 views
In an information economy, data is the new oil! Data Science is transforming the world around us. Machine learning, deep ...
1,178 views
6 years ago
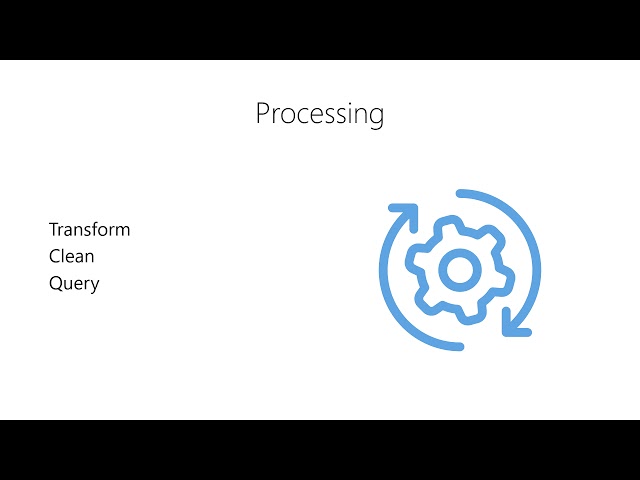
Learn about the Data Science Pipeline with the National Student Data Corps! The second step in the Data Science Pipeline is ...
1,647 views
96 views
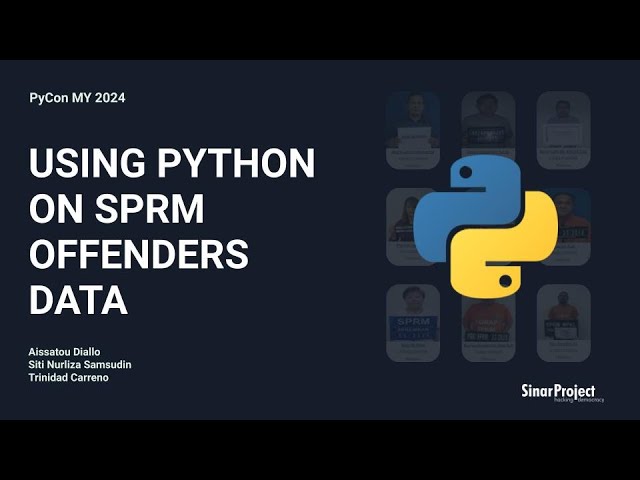
Presentation at Pycon My 2024 on experience of scraping SPRM (MACC) website database of offenders and preliminary analysis ...
94 views
Discover how Data Explorer can speed up your data analysis: https://suzy.com/blog/uncover-hidden-insights-data-explorer.
547 views
Professor Malcolm Sambridge from the Research School of Earth Sciences at ANU has developed mathematical approaches to ...
590 views
10 years ago


![Python (Flask): Activating the report viewer in a Python application [2025]](/api/proxy/image?url=https%3A%2F%2Fi.ytimg.com%2Fvi%2F8AtmJyMJgPc%2Fsddefault.jpg)


![Python (Flask): Customizing the appearance of the Stimulsoft Viewer in a Python application [2025]](/api/proxy/image?url=https%3A%2F%2Fi.ytimg.com%2Fvi%2F5LU6JhIxF1c%2Fsddefault.jpg)


![Python (Flask): Changing the localization of the Stimulsoft Designer in a Python application [2025]](/api/proxy/image?url=https%3A%2F%2Fi.ytimg.com%2Fvi%2F_dWRHeijB-M%2Fsddefault.jpg)