Upload date
All time
Last hour
Today
This week
This month
This year
Type
All
Video
Channel
Playlist
Movie
Duration
Short (< 4 minutes)
Medium (4-20 minutes)
Long (> 20 minutes)
Sort by
Relevance
Rating
View count
Features
HD
Subtitles/CC
Creative Commons
3D
Live
4K
360°
VR180
HDR
2,207,290 results
... charts, and other data visualizations you see on the web today. https://fireship.io/lessons/realtime-charts-d3-firebase/ #javascript ...
590,957 views
4 years ago
In this video, you'll learn how to build a simple and interactive dashboard using Python and the Dash framework. Dash is a ...
840,510 views
2 years ago
Grafana Vs Superset | Which Data Visualization Tool Is Better in 2025? Explore the future of data visualization with our ...
2,226 views
9 months ago
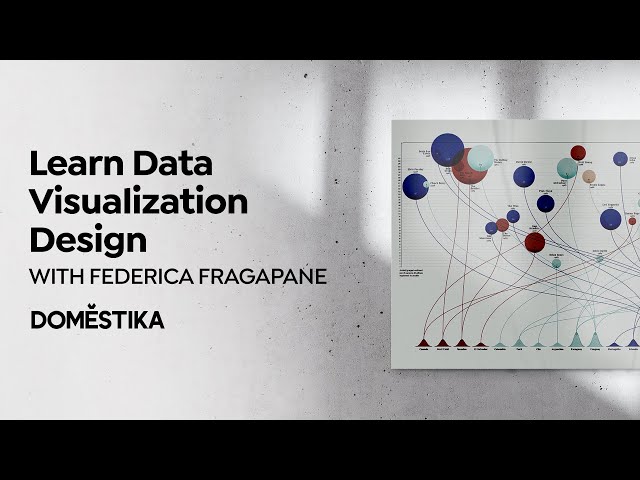
Bring clarity to complexity by creating an engaging data visualization piece that communicates information with ease: ...
36,320 views
In this video we will go through the basics of data visualization. The different ways in which you can transform your data into ...
524 views
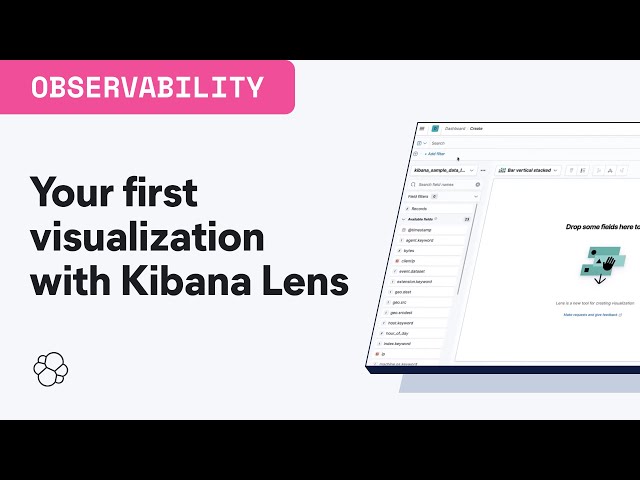
Kibana is your window into the Elastic Stack. It allows you to visualize the data that sits in Elasticsearch. In this video, you will ...
122,538 views
Learn to create captivating narratives by combining digital illustration and collage techniques to design informative and ...
9,786 views
3 years ago
How to build insightful Dashboards in Excel with the help of Microsoft Copilot, a powerful AI tool. Copilot Essentials in 15 minutes ...
629,430 views
1 year ago
Are you in the process of building a BI dashboard (in Power BI, Tableau, etc.)? Consider applying these 15 design principles to ...
178,017 views
... to really understand how data is stored and how to transform that data before you even think about creating data visualizations.
429,770 views
7 months ago
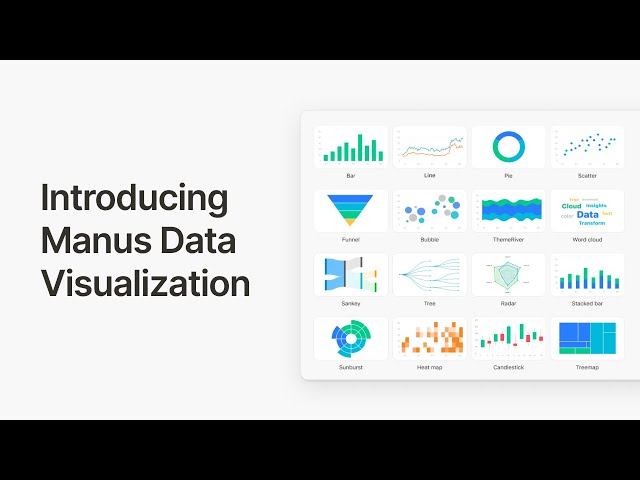
Introducing Data Visualization for Manus! Say goodbye to spreadsheet chaos. Whether you're analyzing competitors, prepping for ...
17,688 views
Data visualization is an important part of most data science projects. Do you know what options you have when it comes to ...
17,556 views
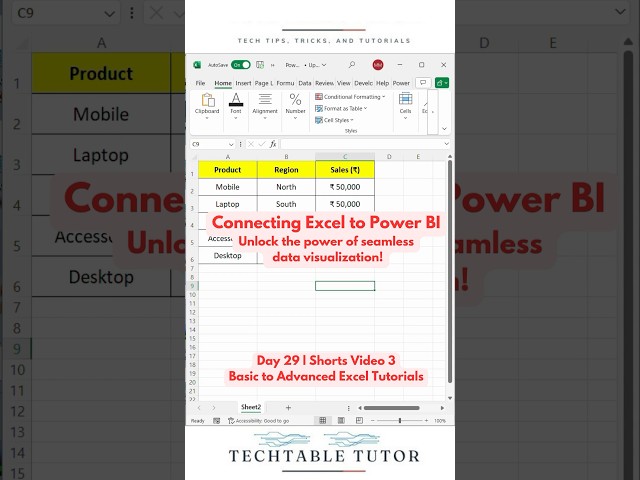
Convert Excel to Power BI in Minutes! Unlock Powerful Insights Today DAY 29, Video 3 In this quick tutorial, learn how to ...
265,567 views
Tableau is easier than you think. You can learn this in 1 hour. #tableau #dataanalyst #dataanalytics #tech #datascience #dataviz ...
201,297 views