Upload date
All time
Last hour
Today
This week
This month
This year
Type
All
Video
Channel
Playlist
Movie
Duration
Short (< 4 minutes)
Medium (4-20 minutes)
Long (> 20 minutes)
Sort by
Relevance
Rating
View count
Features
HD
Subtitles/CC
Creative Commons
3D
Live
4K
360°
VR180
HDR
906 results
Learn how to visualize your data on the Databricks platform. Databricks can create detailed charts with a single click and also ...
23,882 views
9 years ago
In this video, you will learn how to use Databricks AI/BI and geospatial functions to analyze data based on proximity/distance and ...
671 views
1 month ago
AI/BI Dashboards is an AI-assisted experience for BI practitioners to quickly create analytical datasets, interactive dashboards, ...
6,764 views
1 year ago
This video provides an overview of Databricks AI BI, a tool designed to make analytics accessible to everyone. It features ...
3,880 views
5 months ago
Want to try it out? Check out this tutorial: https://docs.databricks.com/en/dashboards/create-a-dashboard.html.
4,542 views
This Data Exploration on Databricks jump start video will show you how go from data source to visualization in a few easy steps.
6,259 views
10 years ago
Databricks and Power BI bring the advantages of Databricks Lakehouse performance and technology to all your users. Use the ...
32,346 views
3 years ago
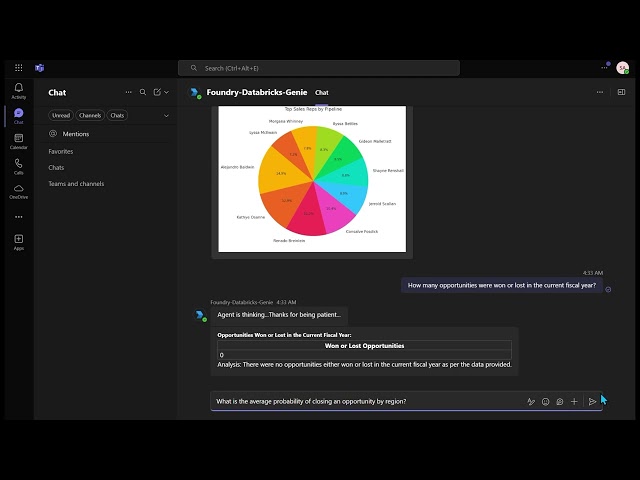
Discover how AI/BI Genie and Azure AI Foundry work together to revolutionize your data intelligence workflow. In this quick ...
3,622 views
6 months ago
Demonstration of the @Databricks' SQL Editor and its visualization capabilities for exploratory data analysis.
409 views
Get exam-ready with this detailed practice test for the Databricks Certified Data Analyst Associate exam! In this video, we go ...
110 views
41 views
Databricks is used for building, testing, and deploying machine learning and analytics applications to help achieve better ...
3,903 views
2 years ago
Tableau and Databricks empower all users with a data Lakehouse for modern analytics. Learn more: ...
13,622 views
3 AI Tools for Data Visualization Everyone Should Try #makemoneywithai Stop wasting hours on tasks that AI can handle in ...
142,745 views
This is the EASIEST way to get your Databricks data on a map! 🗺️ Set up a demo here: ...
879 views
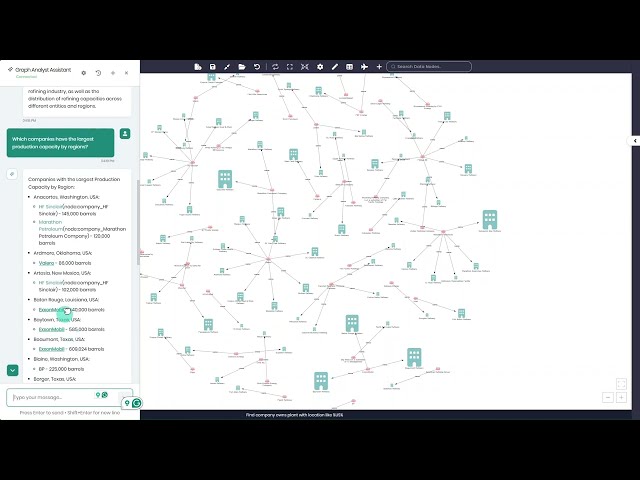
Timbr's Graph Analyst brings AI-powered graph exploration directly into your Databricks environment - no coding required.
287 views
4 months ago
Learn how to monitor and optimize your Databricks costs using smart AI and Business Intelligence (BI) dashboards. In this video ...
216 views
3 months ago
How to Create Dashboard in Azure Databricks (easy Method) | Surfshark VPN Deal — Stay private and secure. $1.99/mo + 3 ...
8 views
... the very basics of creating a very simple visualization do not understand what they're doing creating visualizations is the easiest ...
376,599 views


![Introduction to Databricks - Part8 Data Visualization [Hands on Lab]](/api/proxy/image?url=https%3A%2F%2Fi.ytimg.com%2Fvi%2FVQFdWdWoQPs%2Fsddefault.jpg)