Upload date
All time
Last hour
Today
This week
This month
This year
Type
All
Video
Channel
Playlist
Movie
Duration
Short (< 4 minutes)
Medium (4-20 minutes)
Long (> 20 minutes)
Sort by
Relevance
Rating
View count
Features
HD
Subtitles/CC
Creative Commons
3D
Live
4K
360°
VR180
HDR
669,473 results
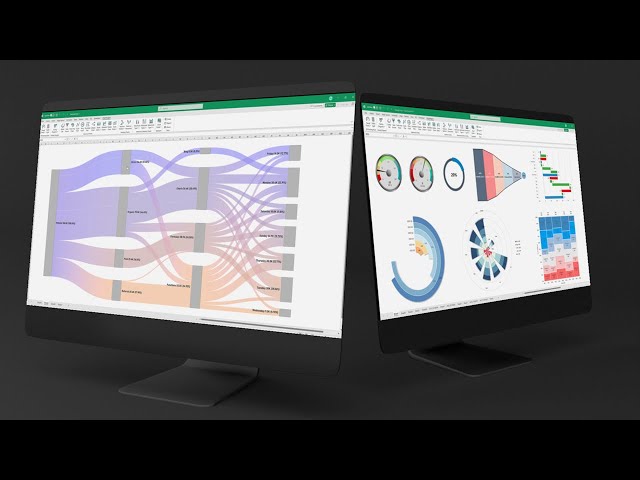
How to build insightful Dashboards in Excel with the help of Microsoft Copilot, a powerful AI tool. Copilot Essentials in 15 minutes ...
536,054 views
1 year ago
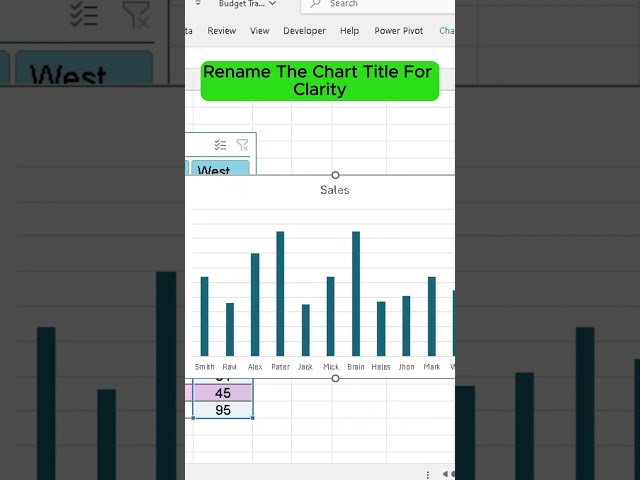
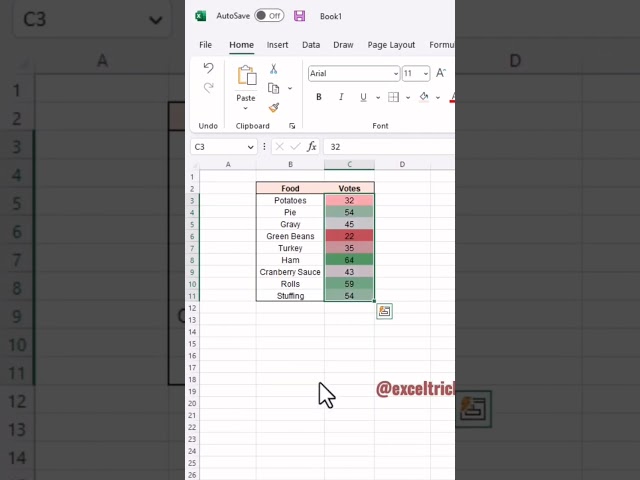
Want to visualize and filter data in Excel like a pro? In this tutorial, I'll show you how to easily create a table, insert a column chart, ...
3,224 views
11 months ago
2,050 views
2 years ago
1,006 views
3 years ago
Saw the intern visualizing his data like this so I showed him this tip activate python store your data as a python data.
72,987 views
739 views
Googlesheet googletranslate in googlesheet 3d SUM IN EXCEL Your Queries: Customize message in excel VSTACK and ...
25,579 views
ChartEngine is an Excel Chart Add-in that provides stunning data visualizations. Learn more: https://chartengine.io/ A picture tells ...
2,133 views
10 months ago
What should you learn after Data Analysis for Excel? Data Visualization in Tableau! #Data #Career #DataAnalyst #Analytics.
514 views
Data visualization in excel | 2 Easy data visualization tools |
82,985 views
Explore stunning Excel dashboard examples designed for clear and effective data visualization. See how charts, graphs, and ...
1,087 views
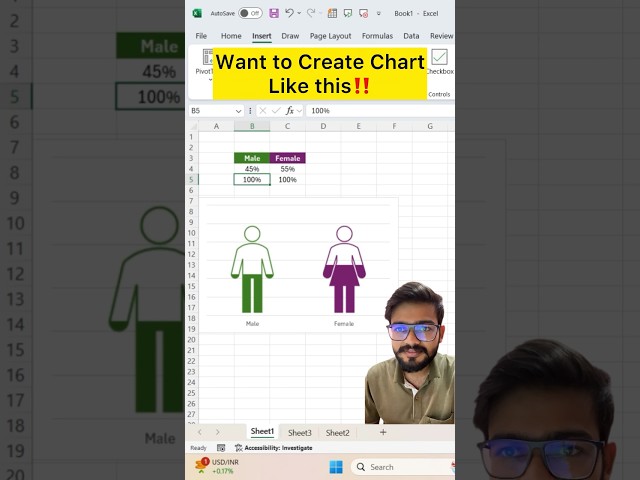
In this video, you will learn how to create Amazing Chart in Excel. Join Telegram Channel to Get Excel Practice Sheets: ...
268,296 views
Did you know that there exists a shortcut to quickly visualize your data in Excel watch till the end to find out if you look at this data ...
337 views
3 Excel Tips for Stunning Data Visualization | Make Charts & Graphs Like a Pro Download our app: https://play.google.com ...
24,963 views
3 months ago
3 AI Tools for Data Visualization Everyone Should Try #makemoneywithai Stop wasting hours on tasks that AI can handle in ...
124,920 views
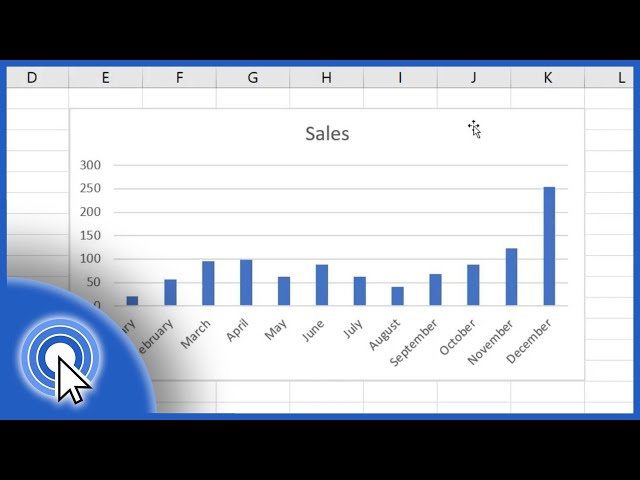
In this video tutorial, you'll see how to create a simple bar graph in Excel. Using a graph is a great way to present your data in an ...
1,793,262 views
6 years ago
For more tips like this plus MUCH more, get unlimited access to the full course below: ...
30,632 views
8 years ago
Unlock the power of data visualization in Microsoft Excel with this step-by-step tutorial! In this project, I'll walk you through ...
35 views
5 months ago
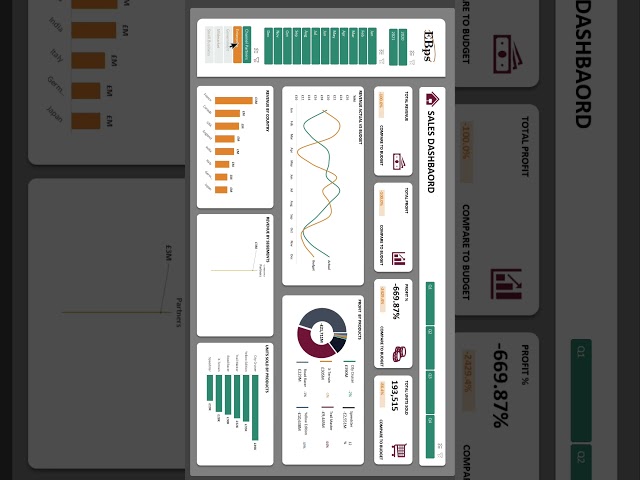
Take your sales reporting to the next level with this comprehensive guide on building a dynamic Sales Excel Dashboard tailored ...
234,309 views
Discover the top 3 essential data visualization tips that will transform the way you use Excel! Whether you're a beginner or an ...
80 views