Upload date
All time
Last hour
Today
This week
This month
This year
Type
All
Video
Channel
Playlist
Movie
Duration
Short (< 4 minutes)
Medium (4-20 minutes)
Long (> 20 minutes)
Sort by
Relevance
Rating
View count
Features
HD
Subtitles/CC
Creative Commons
3D
Live
4K
360°
VR180
HDR
7,401,680 results
11,918 views
1 year ago
Find out how data visualization transforms the way we consume information—and why it's such a powerful force in marketing and ...
172,013 views
14 years ago
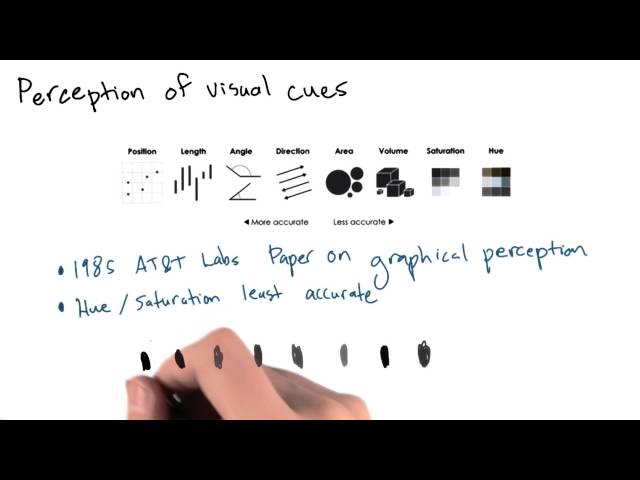
This video is part of an online course, Intro to Data Science. Check out the course here: https://www.udacity.com/course/ud359.
2,175 views
10 years ago
A collection of concepts, projects and work in progress from the year.
6,414 views
3 years ago
Alyosha Efros discusses using computer vision to understand big visual data. Subscribe to O'Reilly on YouTube: ...
1,562 views
9 years ago
Zegami's Visual Data Exploration Platform turns visual data into information. Zegami combines visual content, data and artificial ...
675 views
7 years ago
Learn how to declutter information and visualize data in presentation and reports. Try Venngage For Free: https://venngage.com/ ...
20,377 views
Authors: Danqing Shi, Xinyue Xu, Fuling Sun, Yang Shi, Nan Cao Visual data stories shown in the form of narrative visualizations ...
1,319 views
5 years ago
This demo of the 3D Power BI visual - including in our Rhino Semantic toolkit - shows the use of a 3D model to support ...
54,725 views
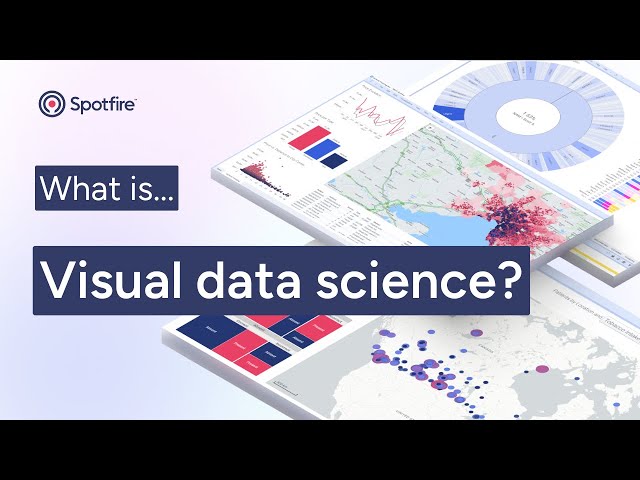
Visual data science helps make smart people—even smarter. Solve your most complex business problems with a tool that ...
467,145 views
10 months ago
This video introduces data and visual analytics as an interdisciplinary science combining computation and visualization for ...
485 views
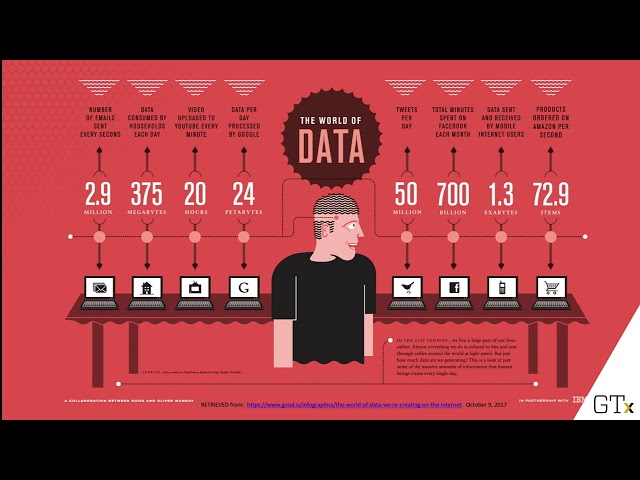
The entire world runs on data. With so much data at our disposal, how do we begin to make sense of it all. The answer can be ...
6,485 views
2,557 views
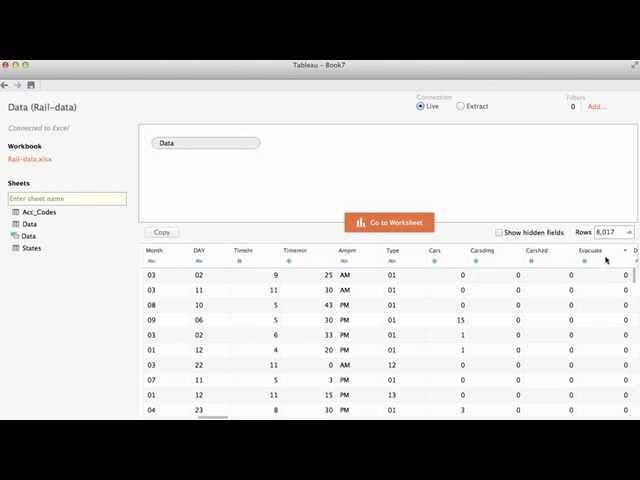
Data connection, join.
5,833 views
11 years ago
(upbeat music) (upbeat music) <v Narrator>In the Summer release</v> we will allow you to blend your data in new ways in the ...
1,112 views
6 years ago
Gramener's Hari, Arihant, and Vyankatesh analyzed the tiger population data from 1973 to date. The 2-minute visual data story ...
916 views
A new generation of technology companies are using complex algorithms to identify the abstract qualities that make images ...
709 views
Gramener's lead designer, Mamta C., analyzed and storified the data from 25th great British beach clean program. Here are some ...
1,308 views
Okay I'd like to talk about I writing task one in this task you're asked to describe some visual data this could be a chart a table ...
1,951 views
13 years ago
Is it possible to add a comment column to the table visual, where you can directly add values from the report page itself? Well ...
17,357 views