ViewTube

ViewTube
Sign inSign upSubscriptions
Filters

Upload date

Type

Duration

Sort by

Features

Reset

136,315 results

Kite
HOW TO USE Matplotlib in 4 MINUTES (2020 Python Tutorial)

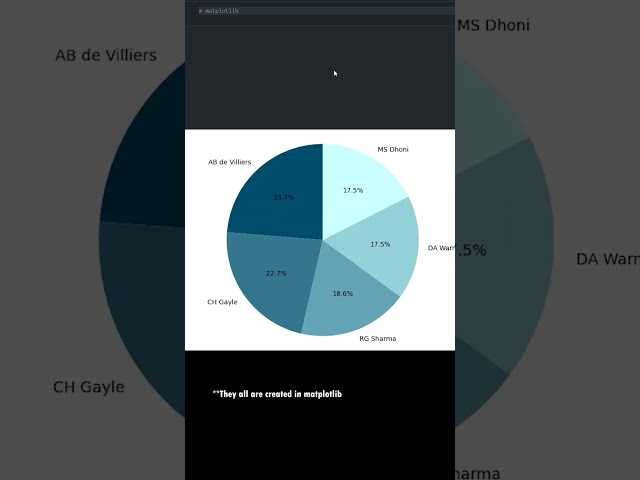
In this video we'll go over the Matplotlib library for Python. Matplotlib is a popular library for creating graphs, plots, and other data ...

3:54
HOW TO USE Matplotlib in 4 MINUTES (2020 Python Tutorial)

168,159 views

5 years ago

TechnicallyRipped
How To Plot Multiple Line Using Matplotlib | Python For Beginners

In this video I show you how to plot multiple lines using the matplotlib library in Python, and how to change the line's color #coding ...

0:53
How To Plot Multiple Line Using Matplotlib | Python For Beginners

3,303 views

2 years ago

Mo Chen
Tableau vs Matplotlib in Python (Which one is better?) #dataanalysis#datavisualization
0:59
Tableau vs Matplotlib in Python (Which one is better?) #dataanalysis#datavisualization

3,211 views

1 year ago

Super Data Science: ML & AI Podcast with Jon Krohn
#Shorts Should you plot with pandas, matplotlib, or seaborn?

From the "675: Pandas for Data Analysis and Visualization" in which @JonKrohnLearns speaks with the author of 'Hands-On Data ...

0:58
#Shorts Should you plot with pandas, matplotlib, or seaborn?

3,814 views

2 years ago

pychallenger
🐍 All Python Programmers Should Know This Matplotlib Life Hack #python #shorts

Matplotlib shortcut every Python programmer and Data Scientist needs to know! Learn how to effortlessly style your plots with ...

0:47
🐍 All Python Programmers Should Know This Matplotlib Life Hack #python #shorts

500 views

1 year ago

Ömer ÖZDEN
Matplotlib Animation

python #matplotlib.

0:10
Matplotlib Animation

1,801 views

5 years ago

CodeVisium
Matplotlib Explained | The Foundation of Python Data Visualization #Matplotlib #DataScience

Matplotlib is the most fundamental and widely used data visualization library in Python, forming the backbone of libraries like ...

0:06
Matplotlib Explained | The Foundation of Python Data Visualization #Matplotlib #DataScience

750 views

3 months ago

Progma Engineer
Matplotlib Markers Tutorial | Python Plotting Tips | Data Visualization

Learn how to use Matplotlib markers in Python for better data visualization. This quick Python plotting tutorial shows different ...

0:29
Matplotlib Markers Tutorial | Python Plotting Tips | Data Visualization

275 views

3 months ago

Amit Thinks
1. Matplotlib Introduction & Features| Python Matplotlib Tutorial for Beginners | Amit Thinks

In this lesson, learn what is Matplotlib with its features. Matplotlib is an open-source plotting library developed by John D. Hunter.

2:25
1. Matplotlib Introduction & Features| Python Matplotlib Tutorial for Beginners | Amit Thinks

24,375 views

2 years ago

Mr. Scientist
Plot Graph in Python using Matplotlib🔥 | #shorts #matplotlib #python

Hello guys, Welcome to my channel Mr. Scientist..... #shorts #python #pythonprogramming #coding #mrscientist #coding ...

0:51
Plot Graph in Python using Matplotlib🔥 | #shorts #matplotlib #python

29,414 views

3 years ago

Code with Geeks
Visualizing Data with Matplotlib 📊 | Python #datascience #matplotlib #datavisualization
1:00
Visualizing Data with Matplotlib 📊 | Python #datascience #matplotlib #datavisualization

8,933 views

2 years ago

Ian Hunt-Isaak
dynamic matplotlib plots. free and open source

automatic sliders to control matplotlib!

0:23
dynamic matplotlib plots. free and open source

1,476 views

3 months ago

CodeVisium
5 Essential Matplotlib Tricks for Data Science 🚀 #matplotlib #Python #DataScience #MachineLearning

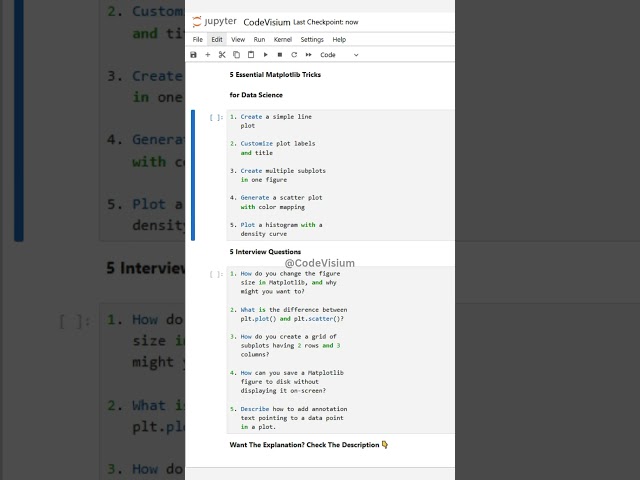
1. Create a simple line plot Drawing a line plot is the foundation for visualizing trends over a continuous variable. In Matplotlib, you ...

0:10
5 Essential Matplotlib Tricks for Data Science 🚀 #matplotlib #Python #DataScience #MachineLearning

626 views

8 months ago

Prwatech
Scatter Plot Using Matplotlib | Python | Prwatech

Learn how to create stunning scatter plots using Matplotlib in Python! In this tutorial, we'll walk you through the basics of scatter ...

2:39
Scatter Plot Using Matplotlib | Python | Prwatech

245 views

9 months ago

AviW Codes
excellent 3D surface with #matplotlib #python

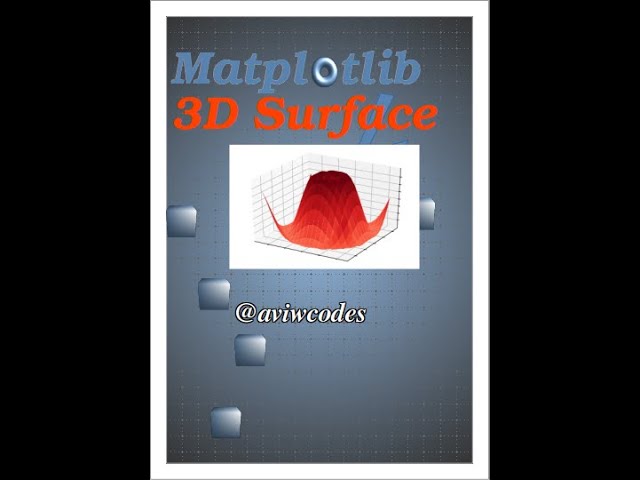
Code: https://github.com/aviwcodes/youtube-shorts/blob/master/plot_shorts/05%20Triangular%203D%20surfaces.py.

0:33
excellent 3D surface with #matplotlib #python

4,778 views

3 years ago

in a minute
All about Matplotlib subplots in UNDER a minute!

Describing how to efficiently use Pyplot Subplots using matplotlib in Python 3.X+ #diy #pycharm #python #pythonprogramming ...

1:00
All about Matplotlib subplots in UNDER a minute!

3,276 views

4 years ago

Learn Coding Skills
Plot Points on Graph using matplotlib in Python! #shorts #programming #coding
0:17
Plot Points on Graph using matplotlib in Python! #shorts #programming #coding

13,187 views

2 years ago

fortranized_pythonista
Getting started with matplotlib | Tutorial | #python

Getting started with matplotlib. Introduction to matplotlib. How to create a plot using matplotlib? #coding #learnpython ...

0:20
Getting started with matplotlib | Tutorial | #python

1,028 views

3 months ago

Dr. Turtl
How the Matplotlib Renderer ACTUALLY Works #datavisualization #python #matplotlib #datascience

The Matplotlib figure canvas renderer can be confusing to wrestle with if you don't know how it actually works. By the end of this ...

1:57
How the Matplotlib Renderer ACTUALLY Works #datavisualization #python #matplotlib #datascience

8,699 views

3 months ago

AviW Codes
3D wireframe plot using #matplotlib #python #pythonprogramming

Code: https://github.com/aviwcodes/youtube-shorts/blob/master/plot_shorts/08%203D%20wireframe%20plot.py.

0:25
3D wireframe plot using #matplotlib #python #pythonprogramming

521 views

3 years ago

IT With Faisal
I Created 3D Plot With 20 Random Lines Using Matplotlib Python #matplotlib #python #3d #graphics
0:24
I Created 3D Plot With 20 Random Lines Using Matplotlib Python #matplotlib #python #3d #graphics

355 views

1 year ago

ModernPython
Control figure size in Matplotlib subplots 📈 #matplotlib #python #shorts

The figure is the overall size that all subplots are drawn on. You can pass in figsize parameter when creating subplots to control ...

0:22
Control figure size in Matplotlib subplots 📈 #matplotlib #python #shorts

864 views

2 years ago