Upload date
All time
Last hour
Today
This week
This month
This year
Type
All
Video
Channel
Playlist
Movie
Duration
Short (< 4 minutes)
Medium (4-20 minutes)
Long (> 20 minutes)
Sort by
Relevance
Rating
View count
Features
HD
Subtitles/CC
Creative Commons
3D
Live
4K
360°
VR180
HDR
136,404 results
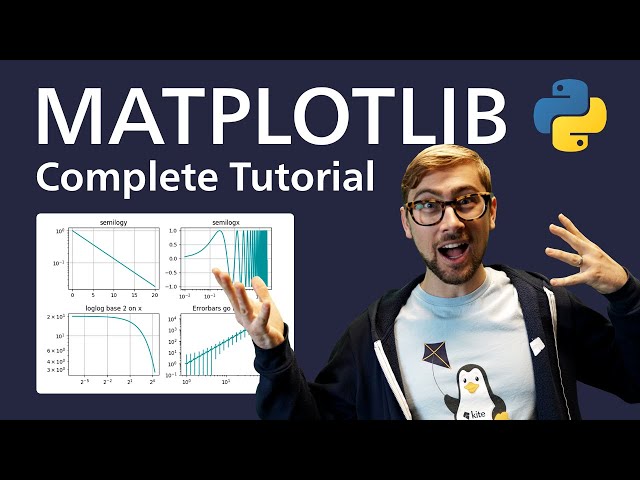
In this video we'll go over the Matplotlib library for Python. Matplotlib is a popular library for creating graphs, plots, and other data ...
168,346 views
5 years ago
In this video, we dive deep into the world of data visualization in Python using three powerful libraries: Matplotlib, Seaborn, and ...
2,492 views
1 year ago
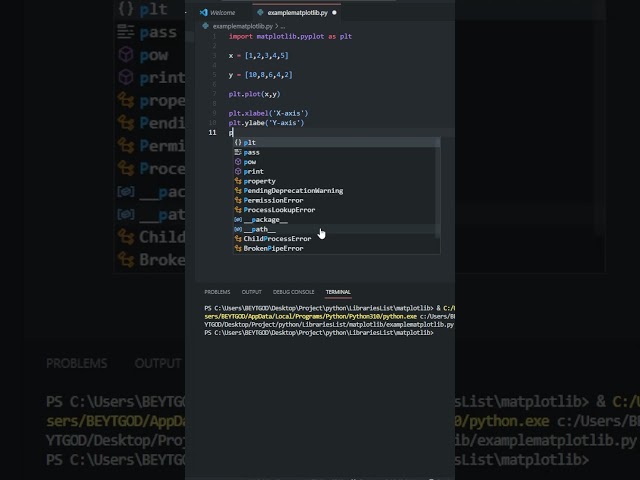
Matplotlib Explained in 100 Secs | Python Plotting for Beginners #MatplotlibPython #Matplotlib #MatplotlibPythonTutorial ...
52,938 views
7 months ago
Matplotlib vs Seaborn vs Plotly: Best Python Visualization Tools.
2,573 views
3 months ago
145,651 views
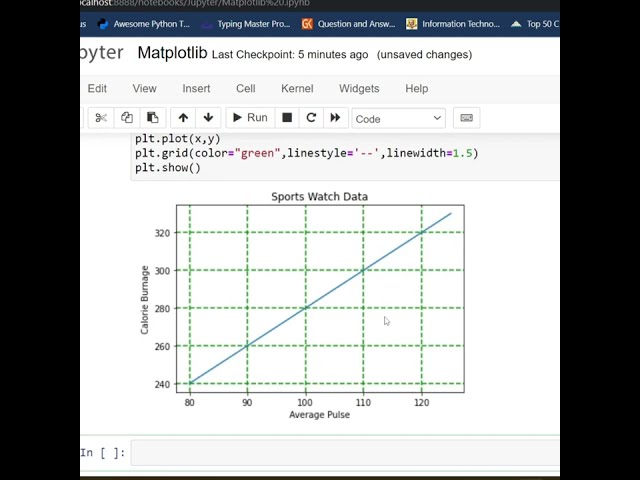
In this video I show you how to plot multiple lines using the matplotlib library in Python, and how to change the line's color #coding ...
3,312 views
2 years ago
3,213 views
From the "675: Pandas for Data Analysis and Visualization" in which @JonKrohnLearns speaks with the author of 'Hands-On Data ...
3,814 views
Exploring basics. Most common Python libraries! #python #coding #explore #matplotlib.
34,166 views
python #matplotlib.
1,802 views
Matplotlib is the most fundamental and widely used data visualization library in Python, forming the backbone of libraries like ...
750 views
Join me on Day 3/100 of my Python journey as I dive into Matplotlib, the powerful library for creating stunning data visualizations!
53,360 views
Learn how to use Matplotlib markers in Python for better data visualization. This quick Python plotting tutorial shows different ...
275 views
4 months ago
In this lesson, learn what is Matplotlib with its features. Matplotlib is an open-source plotting library developed by John D. Hunter.
24,400 views
Learn how to create stunning scatter plots using Matplotlib in Python! In this tutorial, we'll walk you through the basics of scatter ...
246 views
10 months ago
Hello guys, Welcome to my channel Mr. Scientist..... #shorts #python #pythonprogramming #coding #mrscientist #coding ...
29,465 views
3 years ago
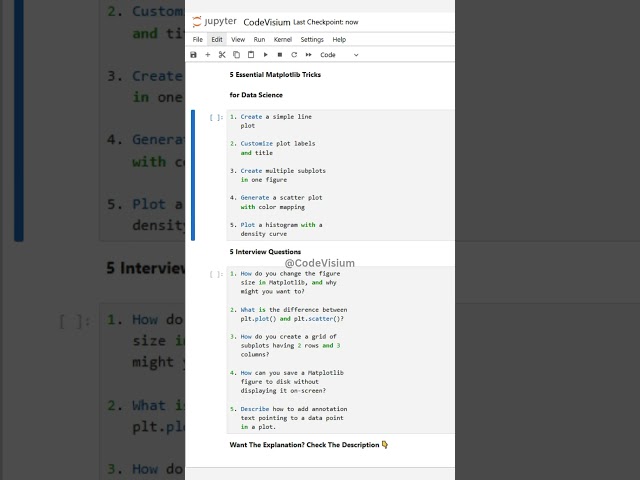
1. Create a simple line plot Drawing a line plot is the foundation for visualizing trends over a continuous variable. In Matplotlib, you ...
626 views
8 months ago
8,943 views
automatic sliders to control matplotlib!
1,480 views
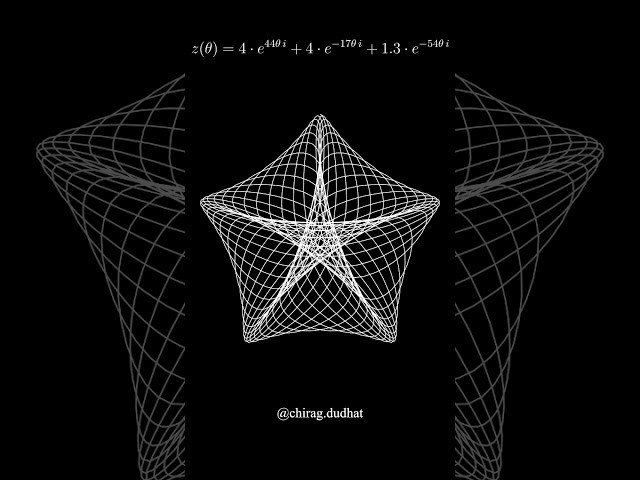
Code: https://github.com/aviwcodes/youtube-shorts/blob/master/plot_shorts/05%20Triangular%203D%20surfaces.py.
4,779 views