ViewTube

ViewTube
Sign inSign upSubscriptions
Filters

Upload date

Type

Duration

Sort by

Features

Reset

101 results

PyPlus
How to Create a Stacked Area Plot Using Python | Matplotlib Visualization

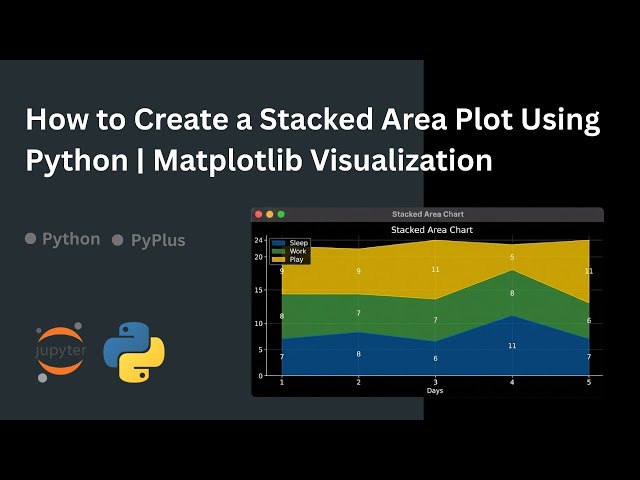
What is a stacked area plot and how can you create one using Python? In this video, you'll learn how to visualize multiple ...

1:37
How to Create a Stacked Area Plot Using Python | Matplotlib Visualization

0 views

6 days ago

The Debug Zone
Matplotlib Make Center Circle Transparent

Today's Topic: Matplotlib Make Center Circle Transparent Thanks for taking the time to learn more. In this video I'll go through your ...

3:07
Matplotlib Make Center Circle Transparent

0 views

4 hours ago

The Debug Zone
Make interactive matplotlib window not pop to front on each update (Windows 7)

Today's Topic: Make interactive matplotlib window not pop to front on each update (Windows 7) Thanks for taking the time to learn ...

1:22
Make interactive matplotlib window not pop to front on each update (Windows 7)

0 views

7 days ago

The Debug Zone
Matplotlib's autoscale doesn't seem to work on y axis for small values?

Today's Topic: Matplotlib's autoscale doesn't seem to work on y axis for small values? Thanks for taking the time to learn more.

1:22
Matplotlib's autoscale doesn't seem to work on y axis for small values?

1 view

2 days ago

The Debug Zone
Scatter plot label overlaps - matplotlib

Today's Topic: Scatter plot label overlaps - matplotlib Thanks for taking the time to learn more. In this video I'll go through your ...

1:22
Scatter plot label overlaps - matplotlib

0 views

3 days ago

TheKnowledgeBase
matplotlib.pyplot.axes() arguments confusion

tech,tech news,best tech,cheap tech,tech gifts,weird tech,tech fails,ces 2025 tech,ces tech,big tech,dog tech,new tech,top tech ...

1:04
matplotlib.pyplot.axes() arguments confusion

0 views

3 days ago

TheKnowledgeBase
Matplotlib scaling an image when saving a converted dxf as PDFvideo

tech,tech news,best tech,cheap tech,tech gifts,weird tech,tech fails,ces 2025 tech,ces tech,big tech,dog tech,new tech,top tech ...

1:04
Matplotlib scaling an image when saving a converted dxf as PDFvideo

0 views

7 days ago

MP Board Commerce Class12th - Arivihan
MP Board Class 12 - Data Handling using Pandas & and Plotting Data (IP) अंतिम युद्ध🔥 | Maha Revision

MP Board Class 12 - Data Handling using Pandas & and Plotting Data (IP) अंतिम युद्ध | Maha Revision ...

Live
MP Board Class 12 - Data Handling using Pandas & and Plotting Data (IP) अंतिम युद्ध🔥 | Maha Revision

12 views

0

Bagupadadham
Data Visualization Explained Simply | Matplotlib

In this video, we explain What is Data Visualization in a very simple way using real-life examples. You will understand why tables ...

2:43
Data Visualization Explained Simply | Matplotlib

6 views

4 days ago

Quarky Angles
Polygons on the complex plane

Animated with Python using Matplotlib and NumPy. In the equation, N determines the number of sides when it is a whole number; ...

0:20
Polygons on the complex plane

13 views

7 days ago

Durga Software Solutions
PYTHON with AI (CORE & ADVANCED) Class Room Training @ DURGASOFT

PYTHON with AI (CORE & ADVANCED) Class Room Training @ DURGASOFT ...

0:35
PYTHON with AI (CORE & ADVANCED) Class Room Training @ DURGASOFT

132 views

7 days ago

Ash2Tutorial
5 Save figure

Code: https://github.com/ash322ash422/youtube/blob/main/matplotlib/L05-save-figure.ipynb Complete playlist for matlotlib: ...

3:27
5 Save figure

5 views

1 day ago

Mobilo
Matplotlib - About the course

Python reigns supreme in data analysis. However, data placed in a table can't speak for itself. Learn to add plots to your ...

1:33
Matplotlib - About the course

0 views

13 hours ago

MJ Lekalakala
Inventory Management E Grocery Python Pandas Code

python #jupyternotebook #kaggle #github #dataanalysis #personalproject #datasets #inventorymanagementegrocerydata ...

1:01
Inventory Management E Grocery Python Pandas Code

0 views

6 days ago

cardinal0303
[Simulation] Galaxy Rotation Curves without Dark Matter (ISUT Model Python Pipeline)

[Video Description] Simulation of Information Entropy-based Emergent Gravity (ISUT) This video demonstrates the simulation ...

0:30
[Simulation] Galaxy Rotation Curves without Dark Matter (ISUT Model Python Pipeline)

103 views

6 days ago

Durga Software Solutions
PYTHON with AI (CORE & ADVANCED) Online Training @ DURGASOFT

PYTHON with AI (CORE & ADVANCED) Online Training @ DURGASOFT ...

0:35
PYTHON with AI (CORE & ADVANCED) Online Training @ DURGASOFT

25 views

7 days ago

Ash2Tutorial
6 subplot: Display multiple plots in one figure

Code: https://github.com/ash322ash422/youtube/blob/main/matplotlib/L06-subplot.ipynb Complete playlist for matlotlib: ...

3:02
6 subplot: Display multiple plots in one figure

4 views

1 day ago

Trading with 9nath
Python Turtle  - How to Draw a Circle in Python

Python Turtle - How to Draw a Circle in Python #python #pythonprogramming #pythonbeginners #pythoncoding #learntocode ...

3:16
Python Turtle - How to Draw a Circle in Python

0 views

6 days ago

Durga Software Solutions
PYTHON with AI (CORE & ADVANCED) Online Training @ DURGASOFT

PYTHON with AI (CORE & ADVANCED) Online Training @ DURGASOFT ...

0:35
PYTHON with AI (CORE & ADVANCED) Online Training @ DURGASOFT

41 views

1 day ago

The Debug Zone
Adding title to the column of subplot below suptitle

Today's Topic: Adding title to the column of subplot below suptitle Thanks for taking the time to learn more. In this video I'll go ...

3:08
Adding title to the column of subplot below suptitle

0 views

2 days ago

Dylan TK Zero To Hero
Dog vs Cat with CNN small project

datascience #machinelearning #python #datascientist #deeplearning #deeplearning #matplotlib #deeplearningproject ...

1:12
Dog vs Cat with CNN small project

0 views

3 days ago

Virtualism
CS619 Final Project | Smart Health Monitoring System | Prototype Demo (Python Flask)

Assalam-o-Alaikum! In this video, I am demonstrating the complete working prototype of the "Smart Health Monitoring System," a ...

2:43
CS619 Final Project | Smart Health Monitoring System | Prototype Demo (Python Flask)

7 views

4 hours ago

Vanga Therinjikalam
IT25201 FODSP -Visualization of Different Kinds of Data | Data Visualization Techniques Using Python

EXP 14 : Data Visualization Techniques Using Python ================================== Visualization of different kinds ...

1:49
IT25201 FODSP -Visualization of Different Kinds of Data | Data Visualization Techniques Using Python

0 views

6 days ago

Prof. Niya Varghese
Advance Python Programming | DS | Module 2 | Practical 2 by Prof. Niya Varghese

SY BSC Computer Science Advance Python for Data Science Refer this for import pandas ...

1:39
Advance Python Programming | DS | Module 2 | Practical 2 by Prof. Niya Varghese

38 views

6 days ago

Justin Brennan
Plotting and Clustering Collab
2:27
Plotting and Clustering Collab

0 views

6 days ago