ViewTube

ViewTube
Sign inSign upSubscriptions
Filters

Upload date

Type

Duration

Sort by

Features

Reset

377 results

DMC Rice
GIS Data Center Virtual Tour
1:12
GIS Data Center Virtual Tour

147 views

4 years ago

Navteca
Surface Winds 360 VR Data Visualization

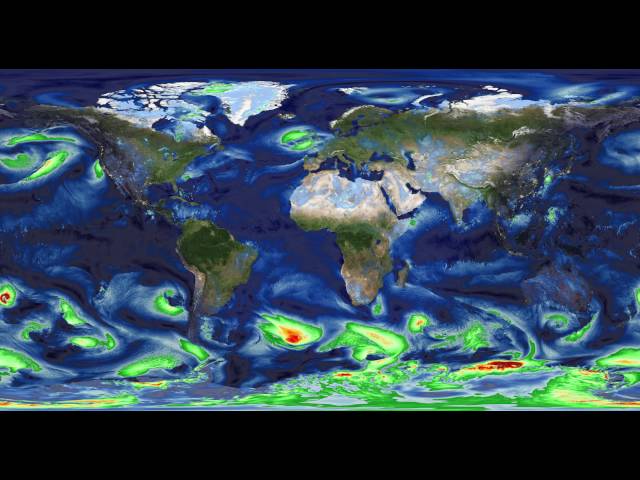
In partnership with the Advanced Information Systems Technology (AIST) Program of the NASA Earth Science Technology Office ...

0:15
Surface Winds 360 VR Data Visualization

403 views

9 years ago

Anhub Metaverse
BUSI650 Business Analytics Week #4 (1/4) Class (360 VR): Data Visualization  using Tableau @ UCW 🇨🇦

Week 4: Data Visualization (DV) using Tableau · Why Data Visualization? · Introduction to Tableau · In-class Demo on Data ...

29:02
BUSI650 Business Analytics Week #4 (1/4) Class (360 VR): Data Visualization using Tableau @ UCW 🇨🇦

61 views

3 years ago

The Racing App
GPS Data Visualisation @ Lingfield Park

GPS Data Visualisation @ Lingfield Park.

3:28
GPS Data Visualisation @ Lingfield Park

136 views

8 years ago

VisualizeAstronomy
360 Panoramic Video:  Mininum Spanning Tree of the Virgo Cluster

Using machine learning to build a Minimal Spanning Tree (MST), we can render the results in 3D using Virgo Cluster data from ...

1:00
360 Panoramic Video: Mininum Spanning Tree of the Virgo Cluster

656 views

10 years ago

Che Wei Wang
Network Formation : glowing shader test

Data: givitas mediumData.

0:27
Network Formation : glowing shader test

19 views

5 years ago

Aviva Investors
The Little World of Data | Aviva Investors 360° VR

Welcome to the Little World of Data - an immersive virtual reality experience designed to take you on a deep dive into data, ...

6:32
The Little World of Data | Aviva Investors 360° VR

411 views

4 years ago

Anhub Metaverse
BUSI650 Business Analytics Week #4 (2/4) Class (360 VR): Data Visualization  using Tableau @ UCW 🇨🇦

Week 4: Data Visualization (DV) using Tableau · Why Data Visualization? · Introduction to Tableau · In-class Demo on Data ...

29:02
BUSI650 Business Analytics Week #4 (2/4) Class (360 VR): Data Visualization using Tableau @ UCW 🇨🇦

63 views

3 years ago

Stefan Marks
Sentience Lab - Earthquake Visualisation 360

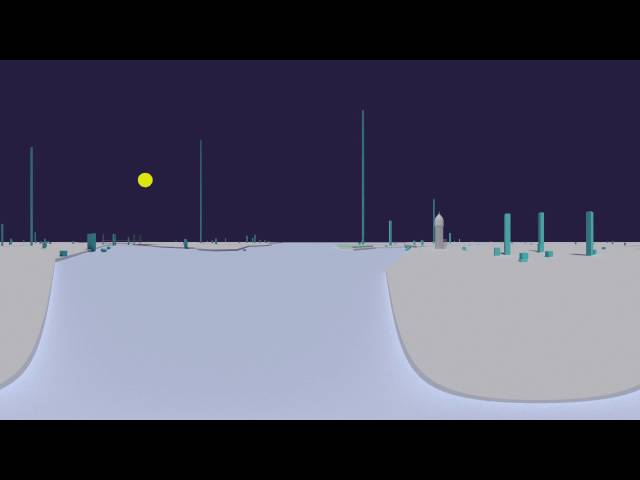
This is the first attempt to render a 360 degree panorama from the Earthquake visualisation. The video shows earthquake data ...

1:20
Sentience Lab - Earthquake Visualisation 360

295 views

9 years ago

Che Wei Wang
Network Formation : S1,2,3,4 Race

Dataset : Givitas fulldata section 1,2,3,4 Yellow : Asian Red : Black/Hispanic Blue : White Orbit Radius : 1000.

0:11
Network Formation : S1,2,3,4 Race

29 views

5 years ago

Che Wei Wang
Network Formation : S1 Race

Dataset : Givitas fulldata section 1 Yellow : Asian Red : Black/Hispanic Blue : White Orbit Radius : 600.

0:20
Network Formation : S1 Race

26 views

5 years ago

Anhub Metaverse
BUSI650 Business Analytics Week #4 (3/4) Class (360 VR): Data Visualization  using Tableau @ UCW 🇨🇦

Week 4: Data Visualization (DV) using Tableau · Why Data Visualization? · Introduction to Tableau · In-class Demo on Data ...

29:02
BUSI650 Business Analytics Week #4 (3/4) Class (360 VR): Data Visualization using Tableau @ UCW 🇨🇦

65 views

3 years ago

PwC UK
The Frontier Data Lab in 360

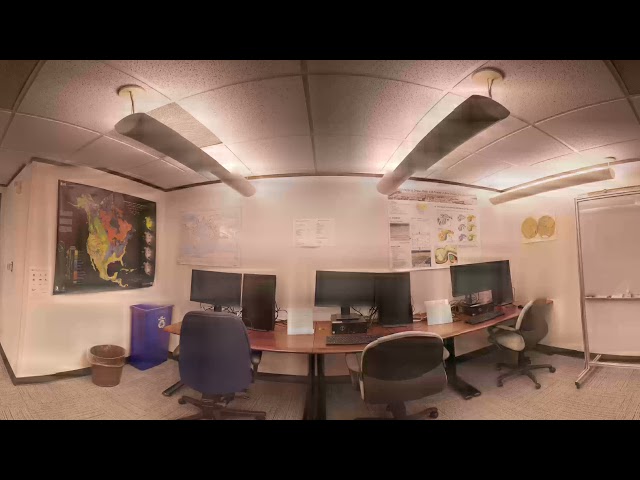
Take a tour around our Data Lab, and explore how you may be able to use this to watch your data come to life in PwC's office.

2:59
The Frontier Data Lab in 360

1,760 views

8 years ago

VisualizeAstronomy
360 Panoramic Video:  Galaxies in the Local Universe

A 360-degree Panoramic video using data from the Cosmicflows-2 database (Tully et al. 2015) that shows galaxies in the nearby ...

3:00
360 Panoramic Video: Galaxies in the Local Universe

3,382 views

10 years ago

Anhub Metaverse
BUSI650 Business Analytics Week #4 (4/4) Class (360 VR): Data Visualization using Tableau @ UCW 🇨🇦

Week 4: Data Visualization (DV) using Tableau · Why Data Visualization? · Introduction to Tableau · In-class Demo on Data ...

25:51
BUSI650 Business Analytics Week #4 (4/4) Class (360 VR): Data Visualization using Tableau @ UCW 🇨🇦

64 views

3 years ago

Che Wei Wang
Network Formation : Givatas fulldata Section 4

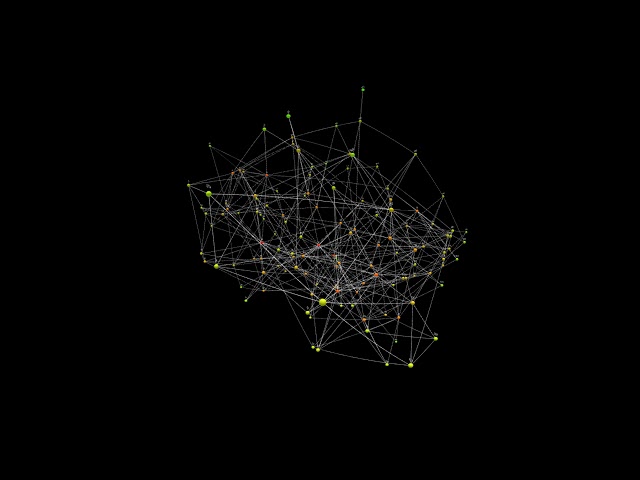
Data : givatas fulldata Node Color : Centrality (Red: high, Green: low) Node Text : Node ID *Try to watch this video with the highest ...

0:55
Network Formation : Givatas fulldata Section 4

3 views

5 years ago

Che Wei Wang
Network Formation : S1 Gender

Data: Givitas fulldata section 1 Blue : Male Red : Female Other/Unknown : Gray Orbit Radius : 600.

0:26
Network Formation : S1 Gender

119 views

5 years ago

yuchen song
气泡图像处理软件BubbleImageProcessing演示视频

气泡图像处理.

9:37
气泡图像处理软件BubbleImageProcessing演示视频

29 views

4 years ago

Che Wei Wang
Network Formation : S1 Gender (8/22 updated)

Dataset : givitas fulldata section 1 Blue : Male Red : Female Camera orbit : 600.

0:32
Network Formation : S1 Gender (8/22 updated)

16 views

5 years ago

drs
360 Istanbul Tweets

This is part of a project to create an open source pipeline for creating 360/VR data visualizations from open data. VR-DataViz ...

0:34
360 Istanbul Tweets

114 views

9 years ago