Upload date
All time
Last hour
Today
This week
This month
This year
Type
All
Video
Channel
Playlist
Movie
Duration
Short (< 4 minutes)
Medium (4-20 minutes)
Long (> 20 minutes)
Sort by
Relevance
Rating
View count
Features
HD
Subtitles/CC
Creative Commons
3D
Live
4K
360°
VR180
HDR
39 results
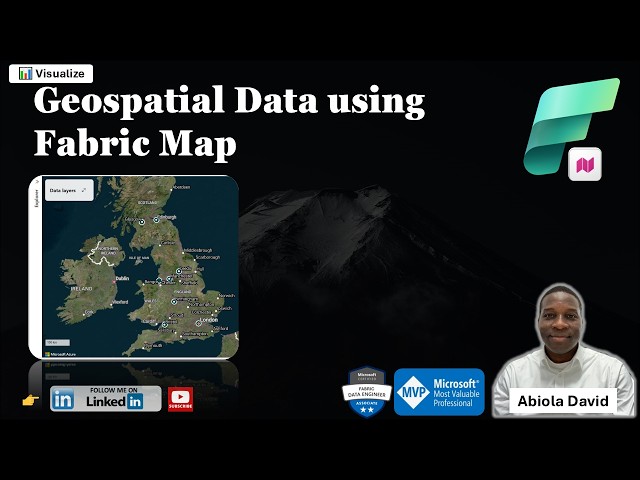
One of the exciting additions to Microsoft Fabric is the Map Item which enables teams to visualize and analyze geospatial data ...
110 views
4 days ago
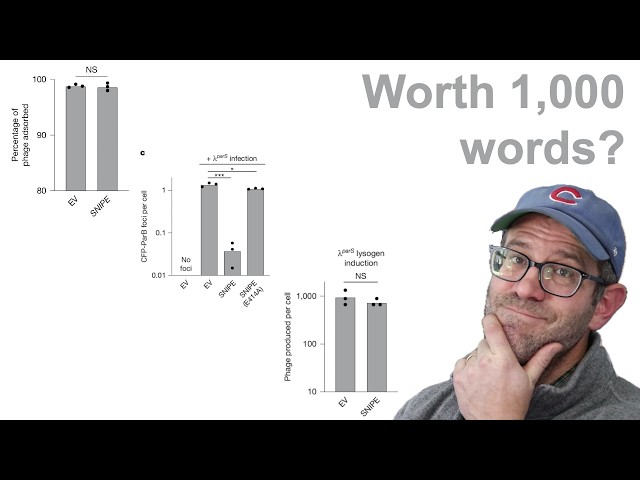
Pat critiques a set of panels from a figure published in the scientific journal Nature looking at a novel mechanism of defense used ...
610 views
Unlock the Power of Crime Mapping in R Do you want to turn raw crime data into powerful, visual insights? This workshop will ...
201 views
Streamed 3 days ago