Upload date
All time
Last hour
Today
This week
This month
This year
Type
All
Video
Channel
Playlist
Movie
Duration
Short (< 4 minutes)
Medium (4-20 minutes)
Long (> 20 minutes)
Sort by
Relevance
Rating
View count
Features
HD
Subtitles/CC
Creative Commons
3D
Live
4K
360°
VR180
HDR
776 results
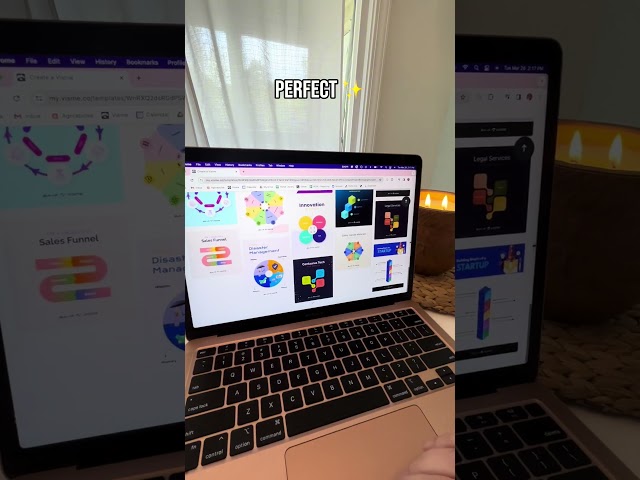
These are my 4 tips to visualise your data that I learned on the the way...
696 views
3 years ago
... Data Analysis Specialization - https://coursera.pxf.io/AoYOdR Tableau Data Visualization - https://coursera.pxf.io/MXYqaN ...
74,027 views
2 years ago
814 views
1 year ago
Try Julius AI - Your Personal Data Analyst: ✓ from Forecasting ✓ to generating Visualisations ✓ or training Neural Networks ✓ or ...
11,883 views
54 views
10 months ago
... charts, analytics reporting and it makes my data look SO good. #dataanalytics #datavisualization #dataviz #infographics #graph ...
948 views
See how ChatGPT can analyze your data and generate insights in just minutes! In this video, I demonstrate how to: ✓ Upload ...
71 views
6 months ago
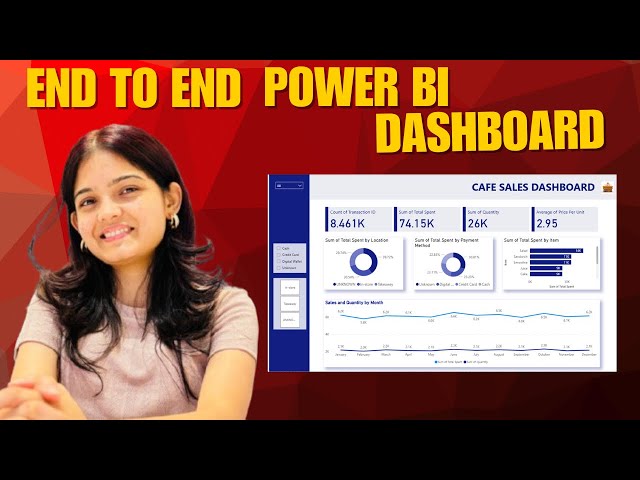
Watch the full Playlist of Power BI - https://www.youtube.com/playlist?list=PL5MLDAaSK7WuU6s8ag-UwIKeC3ho0LTg5 Watch ...
804 views
1 month ago
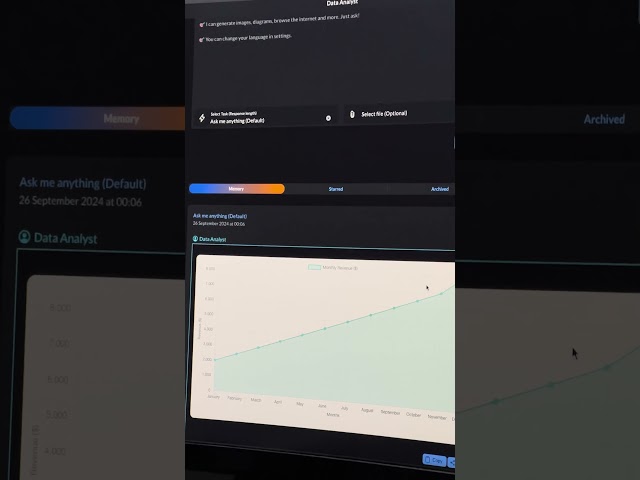
ProMind AI let's you plot graphs and various other visualisations for your data.
558 views
In this video, I show how to read sensor data from an Arduino and visualize the results in real-time using P5.js The data is ...
40 views
For more information on the Workout Wednesday challenge, go to: https://workout-wednesday.com/pbi-2024-w39/
86 views
Welcome to your first step into Data Visualization! In this beginner-friendly video, I'll walk you through what Power BI is, why it's ...
31 views
8 months ago
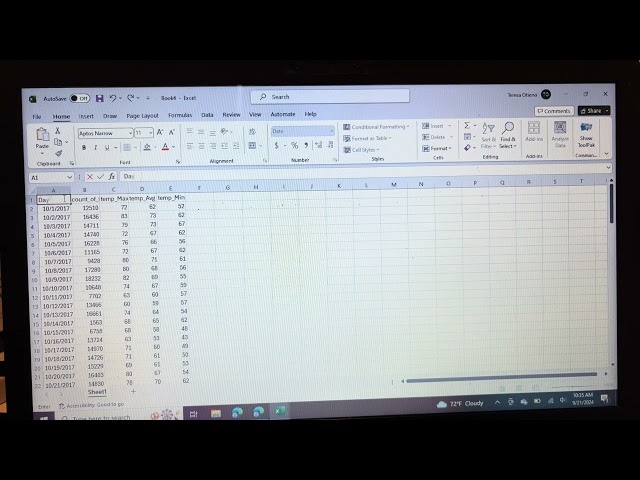
Using Excel to combine two datasets and perform data visualization.
6 views
Take a step forward on Excel : https://www.amazon.com/Excel-Formulas-PivotTables-Conditionnal-Formatting/dp/B0CG8F7TF9 ...
24 views
Let's take a look at the career path of a data analyst starting with an entry-level data analyst you just landed your first job what are ...
107,033 views
The key difference between a data analyst vs a data scientist explained in a few seconds!
378 views
121 views
Want to stand out as a data analyst? In this quick video, I'll show you how to create a portfolio that grabs attention and lands ...
57 views
How to Make Bar Charts in Excel. Excel bar chart and bar graphs tutorial for beginners. Creating a bar chart in Excel is an ...
30 views
My best tips for your data analyst portfolio to get hired...
515 views
Data cleaning and visualization using python.
1 view
2 months ago
#VisualDataLanguage #TechBook #DataScienceBook #AI #AnalyticsBook #NoCodeDataScience #DataVisualization ...
260 views
1,262 views
#graphmaker #datavisualization #slidedeck #powerpoint #presentation #consulting #sales #marketing #analyticsreport.
282 views
11 months ago
Watch My Complete Playlists ▶️ Power BI Full Playlist: ...
147 views
3 months ago