Upload date
All time
Last hour
Today
This week
This month
This year
Type
All
Video
Channel
Playlist
Movie
Duration
Short (< 4 minutes)
Medium (4-20 minutes)
Long (> 20 minutes)
Sort by
Relevance
Rating
View count
Features
HD
Subtitles/CC
Creative Commons
3D
Live
4K
360°
VR180
HDR
9,667,007 results
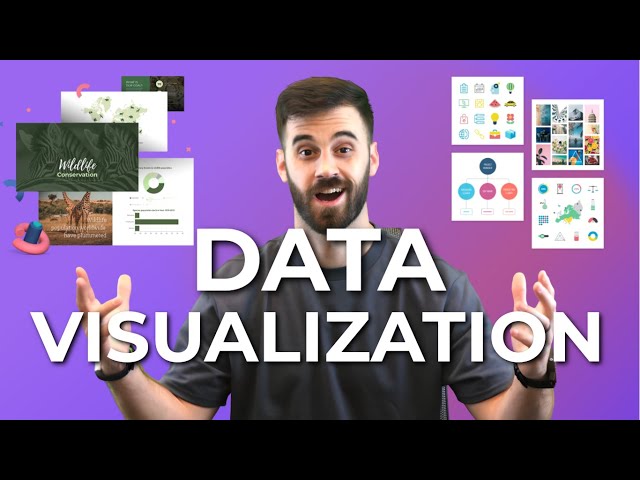
You've probably heard the term data visualization thrown around a lot. It's why you're here, isn't it? So let's make it clear — data ...
181,678 views
3 years ago
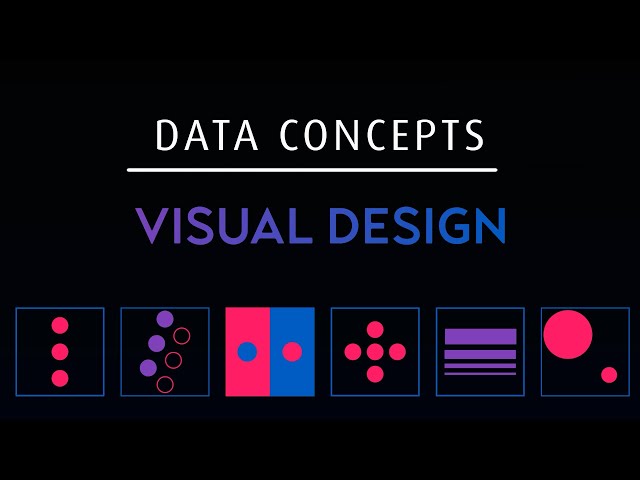
Let's look at how we can implement design concepts and techniques to maximize the impact of our dashboards and reports.
86,843 views
4 years ago
"️ IBM - Data Analyst ...
320,823 views
8 years ago
Links mentioned in this video ⬇️ Exercise File ...
250,334 views
2 years ago
MENTORSHIP – Applications for the March 2026 cohort are now open! Apply here → https://theanalyticsaccelerator.com/ We're ...
50,873 views
11 months ago
This comprehensive tutorial will teach you everything you need to know about Excel chart types, chart customization, and creating ...
111,258 views
1 year ago
In this video, we will demonstrate the difference between data visualization charts including: - Bar Chart - Line Chart - Bubble ...
189,149 views
6 years ago
Turn raw data into stunning visual stories with our new IDE course, Data Visualization in Python! If you've ever stared at a ...
15,559 views
5 months ago
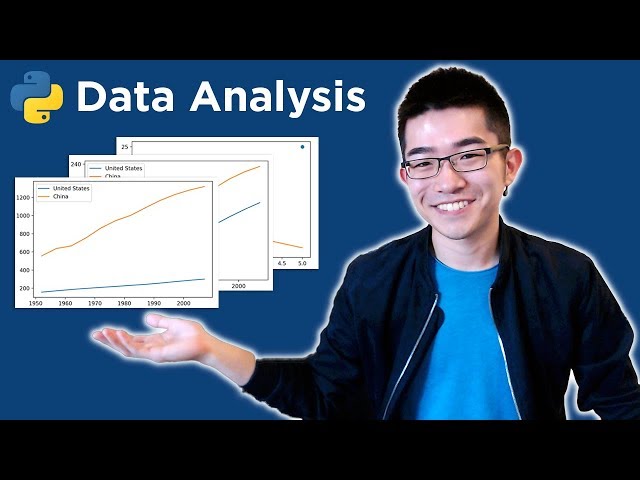
Python data analysis / data science tutorial. Let's go! For more videos like this, I'd recommend my course here: ...
1,532,661 views
7 years ago
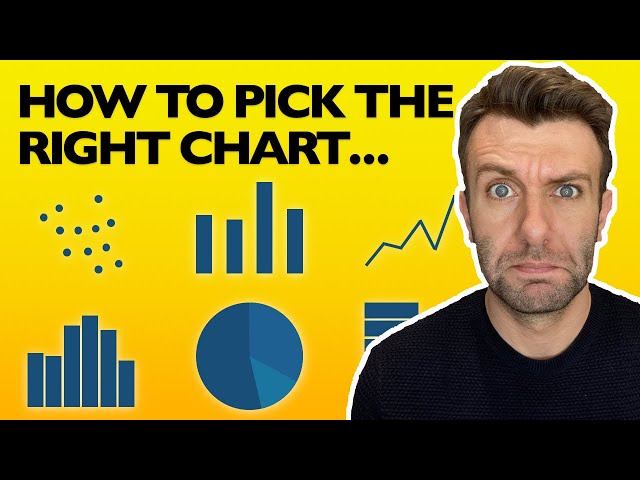
In this Chart, Graph and Data Visualization tutorial for beginners, find out everything you need to know to choose the right type of ...
230,163 views
Learn data visualization with D3.js. D3 is a JavaScript library for manipulating documents based on data. D3 helps you bring data ...
365,091 views
Use the code "DATA" to get 25% off The Big Nodebook!!! https://mtranimationgumroad.gumroad.com/l/thebignodebook/DATA Use ...
100,826 views
6 months ago
Try RESPLENDENT DATA for FREE and unlock the full potential of your data: https://resplendentdata.com/mochen Portfolio, ...
6,266 views
9 months ago
... see how data and 3D can really help us visualize a lot of things that we can't really imagine and also understanding how history ...
31,211 views
Saw the intern visualizing his data like this so I showed him this tip activate python store your data as a python data.
83,960 views
Check out my Full Tableau Course Here: https://www.analystbuilder.com/courses/tableau-for-data-visualization This is our first of ...
985,213 views
Dataviz is easy with R and ggplot. Give me half and hour and I'll show you all the basics and more! If this vid helps you, please ...
63,675 views
Join my Academy, learn Data & AI skills and land a job https://analyticsautomation.academy/ Mind map available here ...
4,853 views
4 months ago