Upload date
All time
Last hour
Today
This week
This month
This year
Type
All
Video
Channel
Playlist
Movie
Duration
Short (< 4 minutes)
Medium (4-20 minutes)
Long (> 20 minutes)
Sort by
Relevance
Rating
View count
Features
HD
Subtitles/CC
Creative Commons
3D
Live
4K
360°
VR180
HDR
2,134 results
Learn how to create advanced Pie Charts, Histograms, and Subplots in Python using the Matplotlib library in this beginner-friendly ...
0 views
1 day ago
Learn how to create a 3D bar chart in Excel quickly and professionally in this step-by-step tutorial. In this video, you will discover ...
3 days ago
This video provides a complete step-by-step tutorial for the **DC Virtual Labs Project**. The tutorial walks through the setup, ...
58 views
5 days ago
In this video we will learn about how to add charts and graphs to Wix, display data visually on Wix pages, beginner guide for ...
19 hours ago
Google Looker Studio is a free data visualization and business intelligence tool developed by Google. It allows users to transform ...
88 views
Microsoft Power BI is a powerful business intelligence (BI) and data visualization tool developed by Microsoft. It allows users to ...
6 days ago
0
This video walks through how to run a RuFaS simulation by creating biophysical input files, linking metadata and file paths, and ...
26 views
Claude now creates diagrams, interactive tools, and visualizations right in the conversation. Follow a student from choosing a ...
111,506 views
16 hours ago
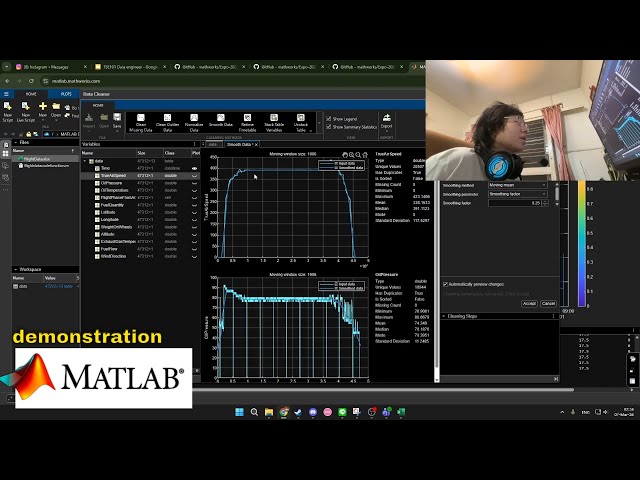
Hello and welcome to the demonstration of the MATLAB program that we are going to be using for data cleaning and visualization ...
20 views
How To Create A Pie Chart In Smartsheet In today's video, we cover Smartsheet pie chart, create pie chart, Smartsheet tutorial, pie ...
4 days ago
#PowerBI #DataAnalytics #BusinessIntelligence #BusinessAnalyst #PowerBITutorial #MicrosoftPowerBI #DataVisualization.
15 views
Tableau is one of the most powerful data visualization and business intelligence (BI) tools used by organizations to transform raw ...
Work with me to land your first job in data analytics: https://bit.ly/4rXFZer You've been lied to, more courses won't get you hired.
6,025 views
Work with me to land your first job in data analytics: https://bit.ly/4rjLHGc The data analytics job market is ruthless right now, and ...
3,023 views
The program covers key concepts such as Python programming, statistics, machine learning, data visualization, and SQL, helping ...
11,121 views
Streamed 2 days ago
Master Microsoft Excel from absolute zero! This is your full beginner tutorial to master spreadsheets. Forget the overwhelm, we'll ...
232 views
In this video we will learn about how to create a sparkline in Google Sheets, add mini charts to Sheets, visualize data with ...
How to Create a Chart Sheet in Excel | How to Put Chart in a Separate Sheet in Excel In this video, you will learn how to create a ...
14 views


![How To Create A Pie Chart In Smartsheet [2026 Guide]](/api/proxy/image?url=https%3A%2F%2Fi.ytimg.com%2Fvi%2FASsxYqZRzow%2Fsddefault.jpg)