Upload date
All time
Last hour
Today
This week
This month
This year
Type
All
Video
Channel
Playlist
Movie
Duration
Short (< 4 minutes)
Medium (4-20 minutes)
Long (> 20 minutes)
Sort by
Relevance
Rating
View count
Features
HD
Subtitles/CC
Creative Commons
3D
Live
4K
360°
VR180
HDR
46 results
Today's Topic: How to control width of graph line in matplotlib? Thanks for taking the time to learn more. In this video I'll go through ...
0 views
2 hours ago
Matplotlib - Increase height of box containing a plot Helpful? Please use the *Thanks* button above! Or, thank me via Patreon: ...
4 hours ago
Learn how to visualize survey and market data effectively with Python techniques for market research analytics. This tutorial ...
6 hours ago
Pandas, NumPy, Matplotlib, or PySpark? Which one is the best? It depends on the problem you want to solve. Each one solves ...
1,955 views
16 hours ago
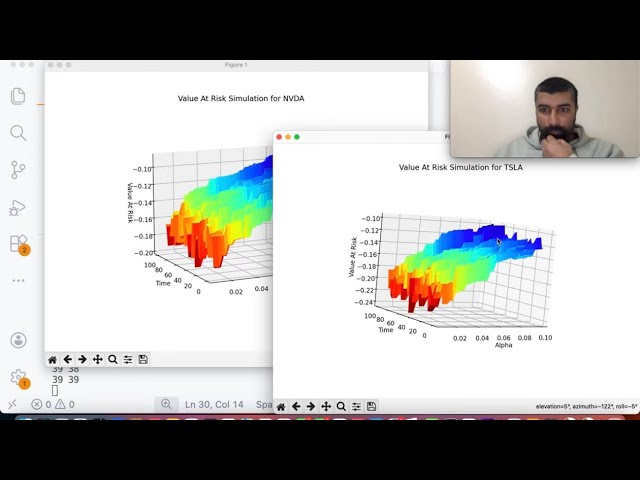
In this video I run a simulation on Nvidia and Tesla to visualize their Value At Risk metrics with varying time and alpha inputs, with ...
6 views
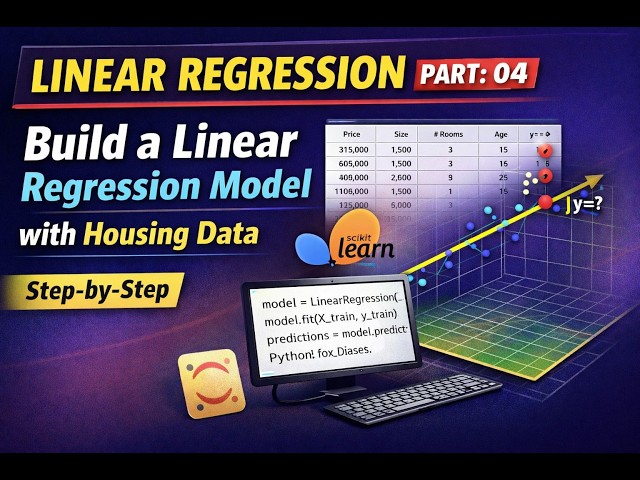
Housing data file link: https://github.com/Ankith-H-Poojary/Regression01/blob/main/Housing.csv Python notebook link ...
15 views
23 hours ago
In this video, we build a Stock Price Prediction Model using LSTM (Long Short-Term Memory) in Python. We use: Python - Pandas ...
70 views
20 hours ago
1. Literature Survey Python has emerged as one of the most widely used programming languages in research due to its simplicity, ...
Data Analyst Masters Program (Discount - YTBE15) ...
1,581 views
Streamed 3 hours ago
802 views
In this video, we implement Linear Regression on the Autos Dataset to build a complete Car Price Prediction Machine Learning ...
38 views
14 hours ago
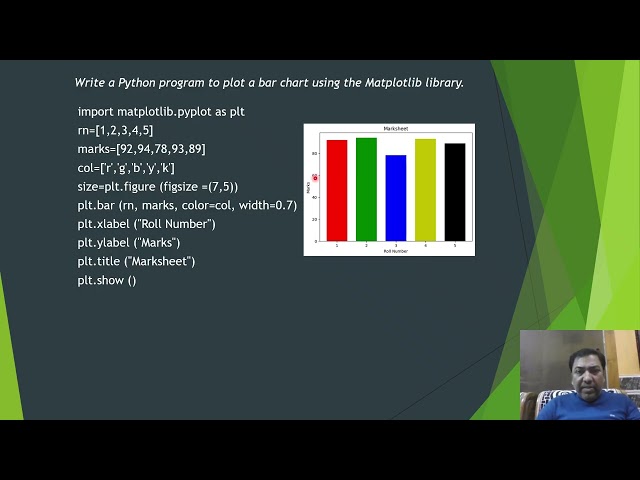
matplotlib, data visualization, #bar_chart, #line_graph, #pie_chart.
48 views
11 hours ago
Free Data Analyst KickStarter Pack - https://datacoaching4628.graphy.com/courses/dataanalyst-freecourse Check Data Analytics ...
234 views
Download the E-Commerce database used in this video here: ...
27 views
Google's Gemini 3.1 Pro might be the most capable AI coding model right now — but there's a serious problem nobody is talking ...
163 views
17 hours ago
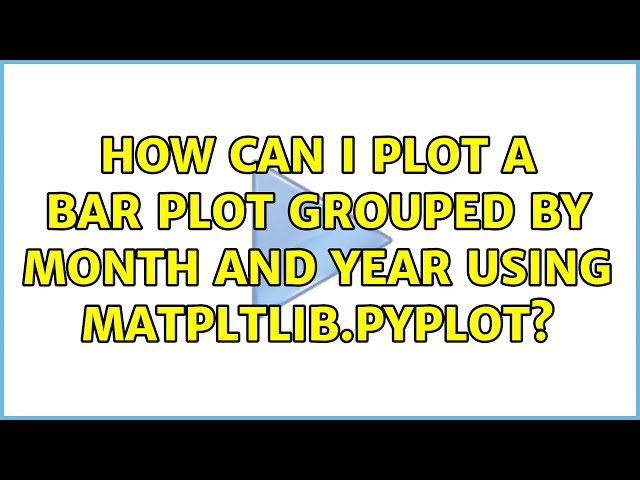
How can I plot a bar plot grouped by month and year using matpltlib.pyplot? Helpful? Please use the *Thanks* button above!
3 views
1 hour ago
In this video, I explained how to calculate the square root in Python using multiple methods. Understanding different approaches ...
Sudoku is a common number puzzle, that can be seen in newspapers, and online portals. It is a 9 x 9 grid, and the idea is to fill ...
9 hours ago
Dive into the world of data analysis in Python as we explore techniques to identify outliers. This comprehensive guide covers ...
13 hours ago
Want to become a Data Scientist in 2026 using Python? Start from zero → master Pandas, NumPy, visualization, machine ...
15 hours ago


![Data Analytics With Python Full Course 2026 [FREE] | Python Data Analytics Tutorial | Simplilearn](/api/proxy/image?url=https%3A%2F%2Fi.ytimg.com%2Fvi%2Fo5M8nYqnj2A%2Fsddefault.jpg)
![Data Analytics With Python Full Course 2026 [FREE] | Python Data Analytics Tutorial | Simplilearn](/api/proxy/image?url=https%3A%2F%2Fi.ytimg.com%2Fvi%2F4ZGJs6TRzls%2Fsddefault.jpg)