ViewTube

ViewTube
Sign inSign upSubscriptions
Filters

Upload date

Type

Duration

Sort by

Features

Reset

796 results

yusakru
AI Agent Converts Messy CSV to Report in 30 Seconds (Minimax Hackathon Project)

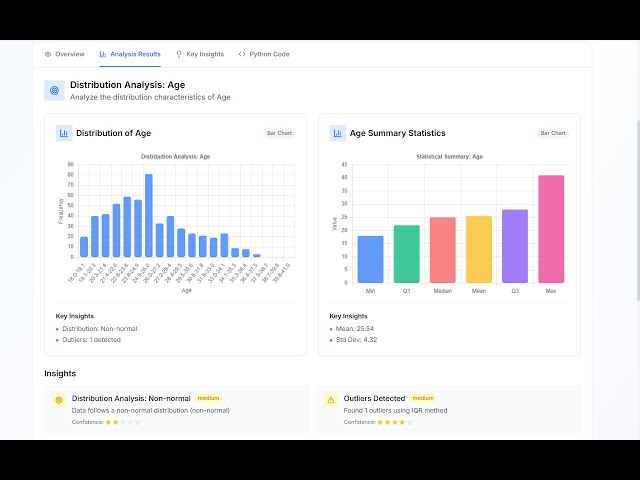
#MinimaxAgent #AIHackathon #NoCode #DataAnalysis #BusinessIntelligence #React #DataVisualization #ArtificialIntelligence.

1:10
AI Agent Converts Messy CSV to Report in 30 Seconds (Minimax Hackathon Project)

50 views

5 months ago

Creative Suite Studio
3 Secrets EXPERTS Use to Insert Maps into MS Excel Spreadsheets

3 Secrets EXPERTS Use to Insert Maps into MS Excel Spreadsheets | Easy Step-by-Step Guide Description: Want to make your ...

3:27
3 Secrets EXPERTS Use to Insert Maps into MS Excel Spreadsheets

52 views

9 months ago

Alex Followell | AI Automation
How To Make Stunning Charts From a CSV in 60 Seconds! (n8n + Datawrapper)

Access AI blueprints, tutorials, tools & expert help to level up fast! https://bit.ly/4lV67U2 Links Mentioned: - ⚡️ n8n: ...

26:27
How To Make Stunning Charts From a CSV in 60 Seconds! (n8n + Datawrapper)

2,094 views

5 months ago

Alex Followell | AI Automation
Turn CSVs into Charts & Insights in Seconds! (n8n)

Join the Skool AI Community – blueprints, tutorials, tools & expert help to level up fast! https://bit.ly/454oVuE Links ...

21:34
Turn CSVs into Charts & Insights in Seconds! (n8n)

10,893 views

7 months ago

360 CodeCamp
Excel Chart Mastery: Transforming Data into Visual Insights

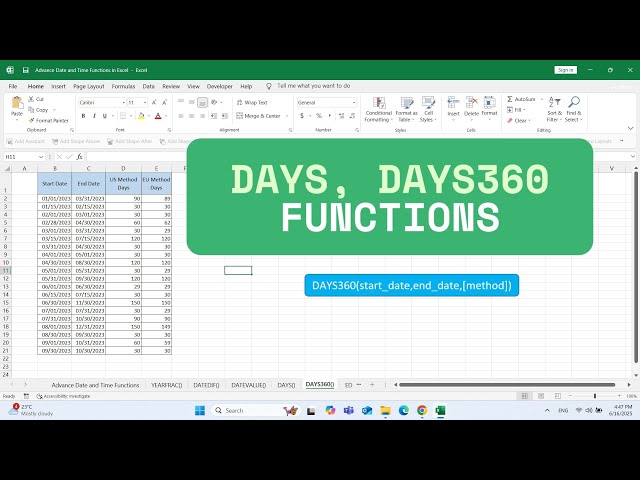
Unlock the power of visual communication and transform your raw Excel data into compelling, insightful charts with our ...

1:21:00
Excel Chart Mastery: Transforming Data into Visual Insights

60 views

10 months ago

Row To Result (R2R)
Excel DAYS & DAYS360 Function Tutorial – What's the Difference?

... "Remove Duplicates Excel" "Data analysis in Excel" "How to clean data in Excel" "Excel for data science" "Data visualization in ...

2:51
Excel DAYS & DAYS360 Function Tutorial – What's the Difference?

150 views

7 months ago

SARA Institute of Data Science
Natalia Kiseleva | Data Visualization using Excel Session 1-4

SARA Institute was founded in April 2023 by Dr. Ajay Kumar Koli & Dr. Kiran Lata. How to Donate to SARA: UPI ID: ...

55:33
Natalia Kiseleva | Data Visualization using Excel Session 1-4

100 views

6 months ago

360 CodeCamp
Excel Basics for Data Analysis - Preparing Data with Microsoft Excel

Dive into the world of data analysis with this beginner-friendly Excel tutorial! Learn the essential skills to prepare data for analysis ...

1:26:28
Excel Basics for Data Analysis - Preparing Data with Microsoft Excel

70 views

11 months ago

SARA Institute of Data Science
Natalia Kiseleva | Data Visualization using Excel Session 4-4

SARA Institute was founded in April 2023 by Dr. Ajay Kumar Koli & Dr. Kiran Lata. How to Donate to SARA: UPI ID: ...

1:02:22
Natalia Kiseleva | Data Visualization using Excel Session 4-4

47 views

6 months ago

Analytics Advisors
1. Microsoft Excel for Absolute Beginners: Start Here!

Welcome to Analytics Advisors – your comprehensive learning hub for mastering data analytics, data visualization, and business ...

13:47
1. Microsoft Excel for Absolute Beginners: Start Here!

65,149 views

7 months ago

Analytics Advisors
4. Learn Microsoft Excel References the Right Way – Most People Get This Wrong!

Welcome to Analytics Advisors – your comprehensive learning hub for mastering data analytics, data visualization, and business ...

15:23
4. Learn Microsoft Excel References the Right Way – Most People Get This Wrong!

66,217 views

6 months ago

SARA Institute of Data Science
Natalia Kiseleva | Data Visualization using Excel Session 2-4

SARA Institute was founded in April 2023 by Dr. Ajay Kumar Koli & Dr. Kiran Lata. How to Donate to SARA: UPI ID: ...

1:07:59
Natalia Kiseleva | Data Visualization using Excel Session 2-4

63 views

6 months ago

Sean Anderson
Excel-1st Steps

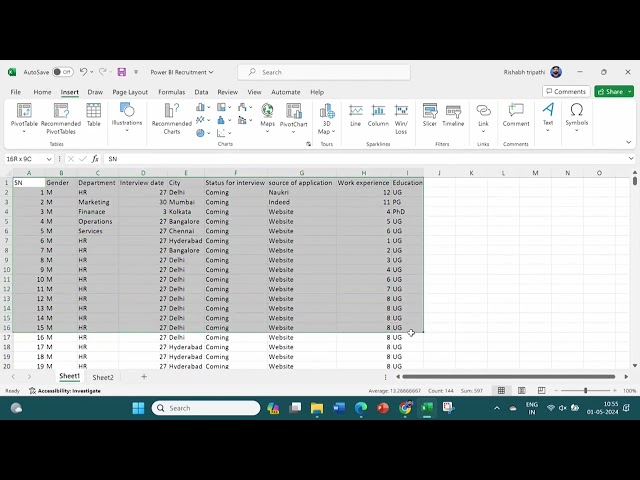
Here we run through the basic approach to data prep, leading up to our creation of our first data visualizations. 1) Dataset ...

27:10
Excel-1st Steps

29 views

11 months ago

SARA Institute of Data Science
Natalia Kiseleva | Data Visualization using Excel Session 3-4

SARA Institute was founded in April 2023 by Dr. Ajay Kumar Koli & Dr. Kiran Lata. How to Donate to SARA: UPI ID: ...

1:02:22
Natalia Kiseleva | Data Visualization using Excel Session 3-4

34 views

6 months ago

Majok Wutchok Studio
Learn Excel in Under 3 Hours | Pivot Tables, Lookups, Data Cleaning | #excel #data

MicrosoftLearn, #MicrosoftCertification - Career development #Azure - Cloud technology #Microsoft365 #PowerPlatform #AI ...

2:38:36
Learn Excel in Under 3 Hours | Pivot Tables, Lookups, Data Cleaning | #excel #data

33 views

7 months ago

Creative Suite Studio
3 Simple Tricks to Master Converting TEXT to Chart in Excel

3 Simple Tricks to Master Converting TEXT to Chart in Excel Are you tired of manually creating charts in Excel? Do you want to ...

4:33
3 Simple Tricks to Master Converting TEXT to Chart in Excel

46 views

9 months ago

Creative Suite Studio
Can You Calculate Your Age in JUST 5 Minutes with MS EXCEL?

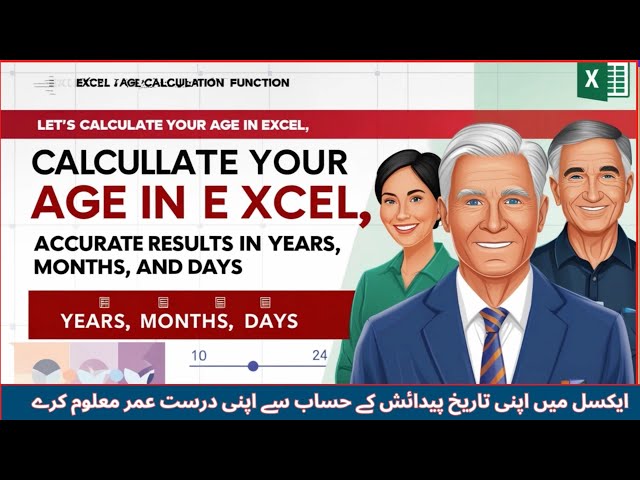
Can You Calculate Your Age in JUST 5 Minutes with MS EXCEL? Learn how to calculate your age in just 5 minutes using ...

4:05
Can You Calculate Your Age in JUST 5 Minutes with MS EXCEL?

96 views

10 months ago

Brad Peirson
Learn How to Create a Scatter Plot in Excel | X-Bar Chart Example

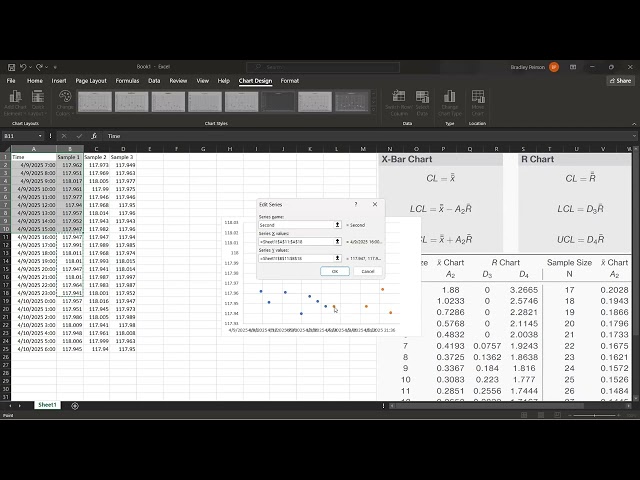
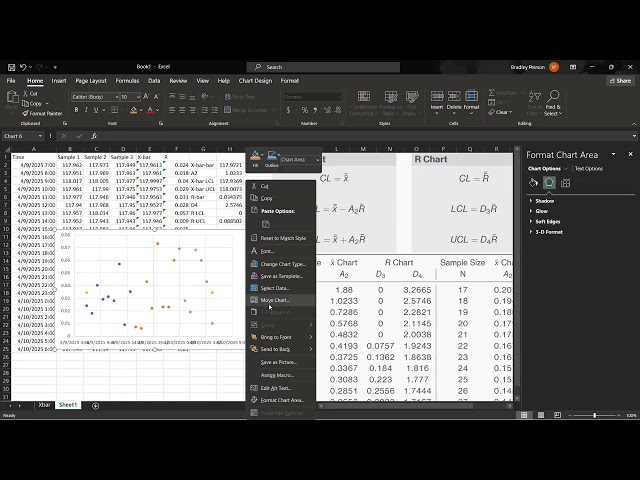
... comment, and subscribe for more Excel and data visualization tutorials! #ExcelTutorial #ScatterPlot #XBarChart #QualityControl ...

1:02:52
Learn How to Create a Scatter Plot in Excel | X-Bar Chart Example

19 views

9 months ago

360 CodeCamp
Master Pivot Tables in Excel | Pivot Charts & Slicers for Interactive Dashboards in 2025

Ready to take your Excel skills to the next level? In this complete Pivot Tables masterclass, you'll learn step by step how to ...

1:07:42
Master Pivot Tables in Excel | Pivot Charts & Slicers for Interactive Dashboards in 2025

49 views

3 months ago

Codanics
Data Visualization Workshop Live in urdu hindi for everyone A-Z

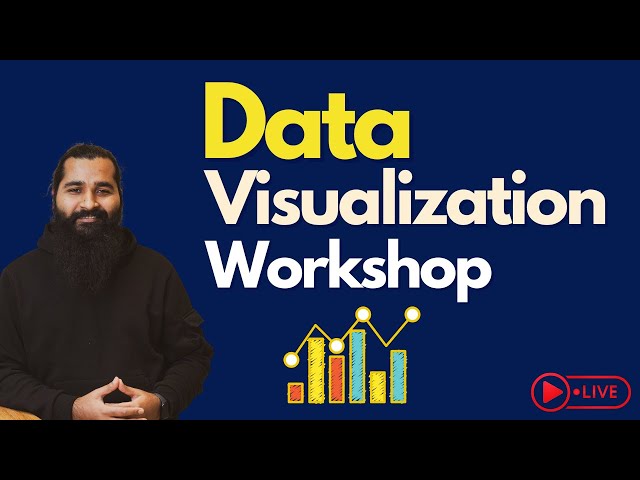
WELCOME to our real-time Data Visualization boot-camp! Whether you're a student, freelancer, or professional, this Urdu/Hindi ...

1:03:35
Data Visualization Workshop Live in urdu hindi for everyone A-Z

3,634 views

Streamed 6 months ago

Brad Peirson
Creating an R Chart in Excel | Companion to X-Bar Chart Tutorial

This video demonstrates how to create an R chart (range chart) in Microsoft Excel using the same dataset from the x-bar chart ...

24:40
Creating an R Chart in Excel | Companion to X-Bar Chart Tutorial

12 views

9 months ago

Creative Suite Studio
Discover the POWER of Excel's Text Extraction Functions!

Discover the POWER of Excel's Text Extraction Functions! Unlock the full potential of Microsoft Excel by mastering its powerful text ...

8:26
Discover the POWER of Excel's Text Extraction Functions!

77 views

9 months ago

CH 25: IIT KANPUR 02: Humanities & Social Sciences
Lec 11: Data Visualization Excel - 1 #CH25SP #swayamprabha

Subject : HSS Course Name : HR Analytics Welcome to Swayam Prabha! Description: Welcome to CH 25: IIT KANPUR ...

29:18
Lec 11: Data Visualization Excel - 1 #CH25SP #swayamprabha

47 views

3 months ago

Analytics Advisors
75. Master Donut Charts in Excel in 4 Minutes 🔥

My Microsoft Excel Playlist: https://www.youtube.com/playlist?list=PLHrw3fxxgFBRyH308kfvRZnAIevkaKkf0 Are you using Donut ...

3:57
75. Master Donut Charts in Excel in 4 Minutes 🔥

10,839 views

2 days ago

Analytics Advisors
68. Excel Charts Made Beautiful Using the Chart Format Tab

My Microsoft Excel Playlist: https://www.youtube.com/playlist?list=PLHrw3fxxgFBRyH308kfvRZnAIevkaKkf0 Want to make your ...

2:54
68. Excel Charts Made Beautiful Using the Chart Format Tab

8,540 views

2 weeks ago