Upload date
All time
Last hour
Today
This week
This month
This year
Type
All
Video
Channel
Playlist
Movie
Duration
Short (< 4 minutes)
Medium (4-20 minutes)
Long (> 20 minutes)
Sort by
Relevance
Rating
View count
Features
HD
Subtitles/CC
Creative Commons
3D
Live
4K
360°
VR180
HDR
8,029 results
Tommaso Battisti - Visualizing the Humanities: A Survey of Visualization Practices, Narrativity, and Critical Approaches in Digital ...
6 views
4mo ago
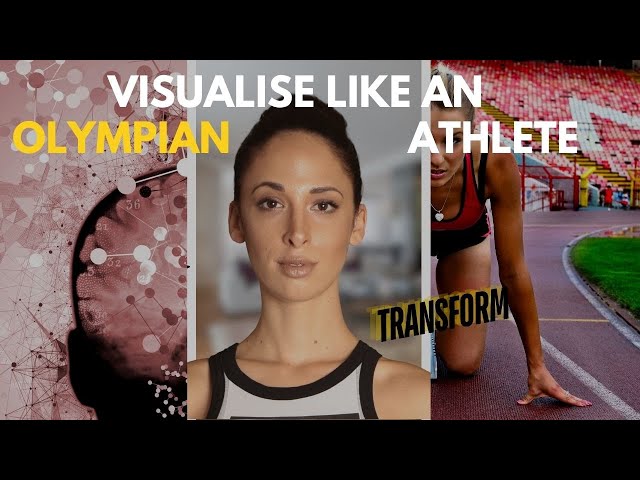
Unlock the mental strategies of the world's most elite athletes. In this video, I share the Olympian Visualization Formula—a proven ...
21 views
9mo ago
Music isn't just for your ears. When you compose with algorithms, you need to see the data. In this video, I introduce the "Visual ...
100 views
2mo ago
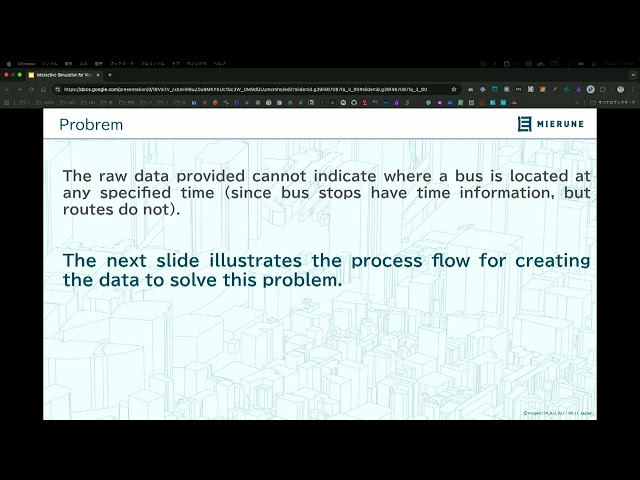
Presented by Kei Yamazaki on 20 November 2025 09:40, at FOSS4G 2025 Auckland. Track: Lightning talk Full presentation ...
30 views
3mo ago
In this video we take a look at the best resources to learn Data Visualization in 2025! 25% off Analyst Builder Code: ...
16,355 views
10mo ago
Canadian Bioinformatics Workshop series: - Introduction to R - Data Visualization (Han Yu) - Day 2, Module 4 Lecture slides and ...
46 views
Chapter 8: Media Visualizations. Play your favorite music with many types of Visualizations on the screen in Windows XP Media ...
2,950 views
"SciBlend: Advanced Data Visualization Workflows" by José Marín at Blender Conference 2025 Scientific data visualization is ...
3,413 views
7mo ago
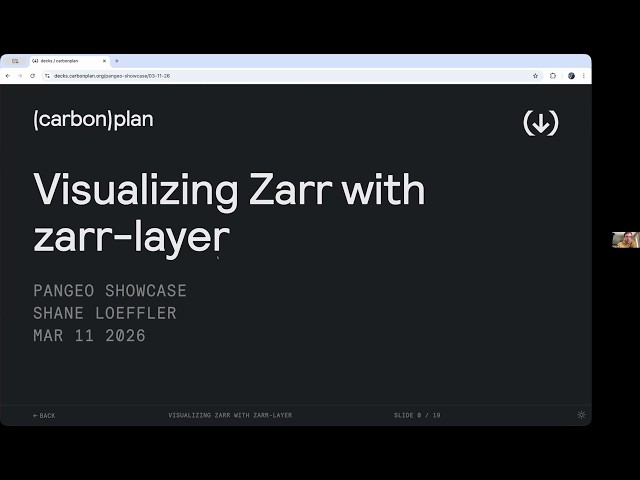
Title: “Visualizing Zarr with zarr-layer” Speaker: Shane Loeffler When: Wednesday, March 11, 2026 at 4 PM US Eastern ( March ...
147 views
4w ago
In memory of Roger Garrison, Bob walks through Garrison's famous capital-based macroeconomics diagrams, showing how they ...
3,004 views
Here are some test I did with AI. Results are impressive! I used nano banana and Veo 3 ai tools.
1,247 views
Course Link:- https://www.khanacademy.org/math/class-6-ncf Description: In this video, we will try to make sense out of many ...
1,000 views
Click the Link below : https://mindandgutwellness.com/ Send Whatsapp message ''Hello"' To 7039111233 Click the Link below ...
76,311 views
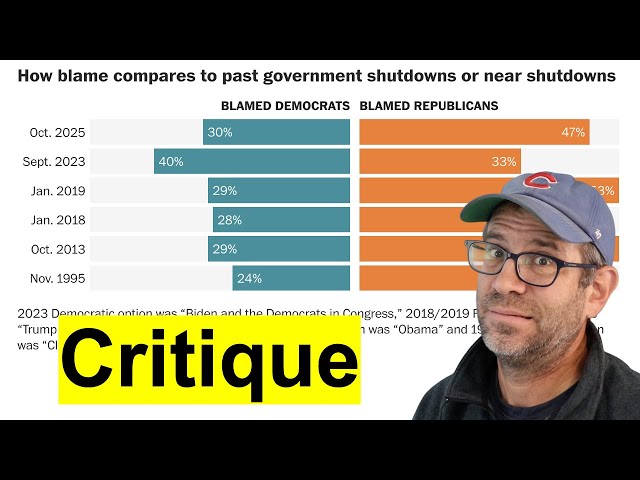
Pat introduces the DAIJ model for giving a critique to a data visualization that is often used to critique art. By describing, analyzing ...
724 views
5mo ago
NYC Open Data Week 2025 (March 27) A school “colocation” occurs when two or more public schools share the same school ...
41 views
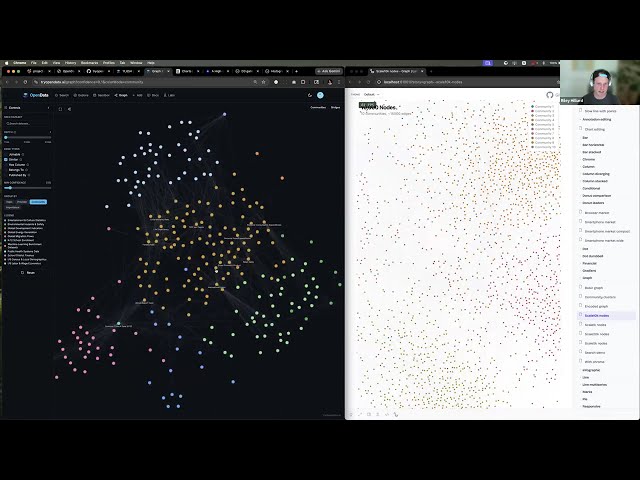
Riley Hilliard discusses OpenChart: Open source journalistic data visualization (think open source datawrapper/flourish) on ...
107 views
7d ago
In our first episode, Dan Chudnov and Ed Summers introduce themselves, get their bearings, and eventually look at a new ...
22 views
1mo ago
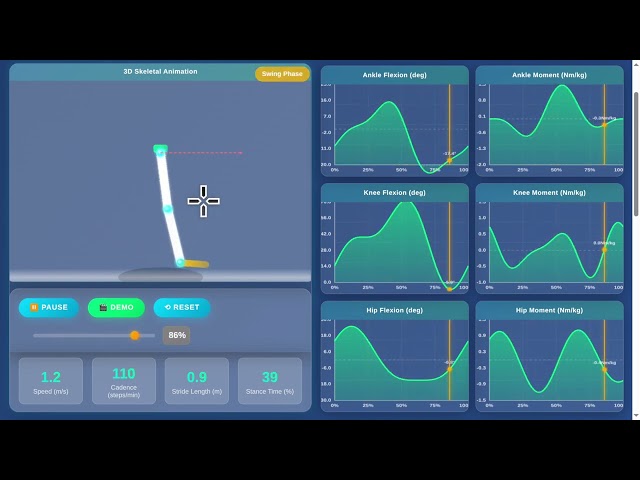
How do we translate complex biological movement into actionable data? This video explores the intersection of biomechanics, ...
58 views
SARA Institute was founded in April 2023 by Dr. Ajay Kumar Koli & Dr. Kiran Lata. How to Donate to SARA: UPI ID: ...
115 views
This video covers topics related to visualizing qualitative data including bar graphs and pie charts.
193 views