Upload date
All time
Last hour
Today
This week
This month
This year
Type
All
Video
Channel
Playlist
Movie
Duration
Short (< 4 minutes)
Medium (4-20 minutes)
Long (> 20 minutes)
Sort by
Relevance
Rating
View count
Features
HD
Subtitles/CC
Creative Commons
3D
Live
4K
360°
VR180
HDR
146,835 results
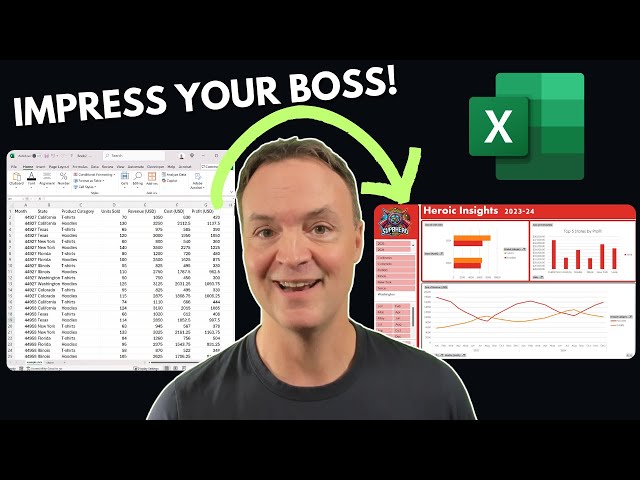
Build an interactive Excel dashboard for better data visualization in less than 20 minutes. ❗Master Excel with my courses: ...
75,855 views
1 year ago
Learn Excel in just 2 hours: https://kevinstratvert.thinkific.com In this step-by-step tutorial, learn how to pull together charts in Excel.
1,255,205 views
2 years ago
AD: Sign up to enroll for a 7-day free trial with Coursera now!
3,078,532 views
... DOWNLOAD Free Excel file for this video: https://view.flodesk.com/pages/63dd44d5781752946ff2af78 In this video we'll build a ...
1,753,399 views
3 years ago
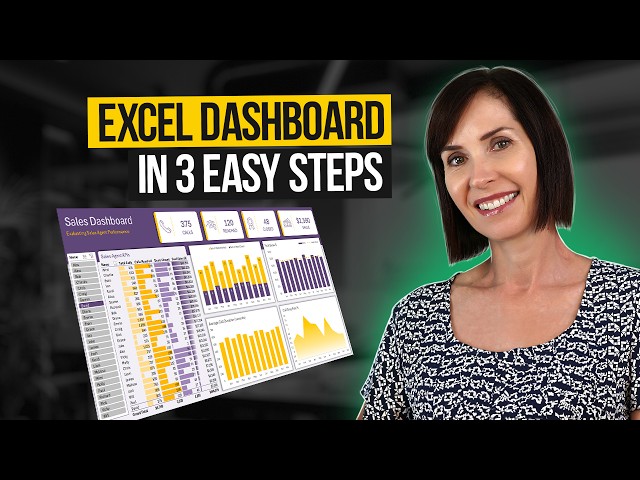
In this step-by-step tutorial, learn how to create dynamic and interactive Excel dashboards. With a dashboard, you can showcase ...
3,547,059 views
4 years ago
Create charts that wow your audience. Learn the secrets now—start today! https://link.xelplus.com/yt-g-basics-charts-course ...
1,183,364 views
8 years ago
Ready to transform your spreadsheets from ordinary to extraordinary? In this tutorial, you'll learn how to take raw, unorganized ...
112,660 views
Try think-cell for free: https://tinyurl.com/xelplus Create professional business charts in Excel—start here ...
618,424 views
How to analyze data with no programming languages in 10 minutes. Improve your productivity in Excel with Power Query: ...
136,717 views
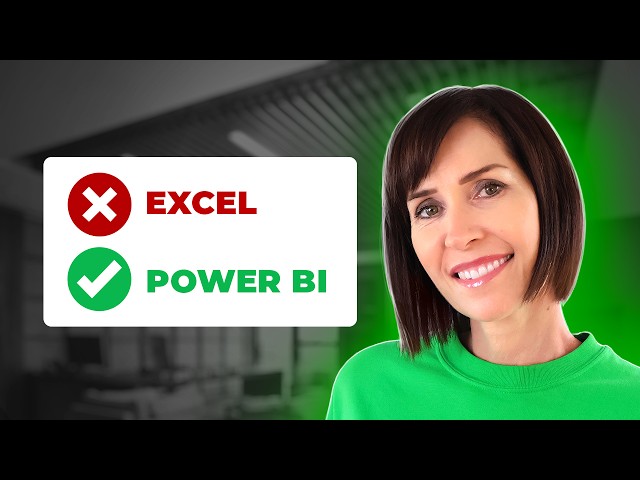
Welcome to this beginner's tutorial on how to use Microsoft Power BI! In this video, I will guide you through importing data from an ...
201,775 views
Learn how to use Power BI for data analysis and interactive dashboards. ➡️ Download the example file here and follow along: ...
113,796 views
https://other-levels.com/products/one-time-full-access The #1 Website Worldwide for Excel Dashboard Templates, Reports, ...
6,387,139 views
This amazing Excel trick will blow your mind! In this video, I'll show you how to create stunning bar charts using nothing but the ...
3,647 views
5 months ago
How to Make Interactive Excel Dashboards & ONE CLICK Update. Master Excel now with 20% off all courses until Feb 15, ...
310,013 views
Get our Excel Course here: https://www.careerprinciples.com/courses/excel-for-business-finance DOWNLOAD Free Excel file ...
511,799 views
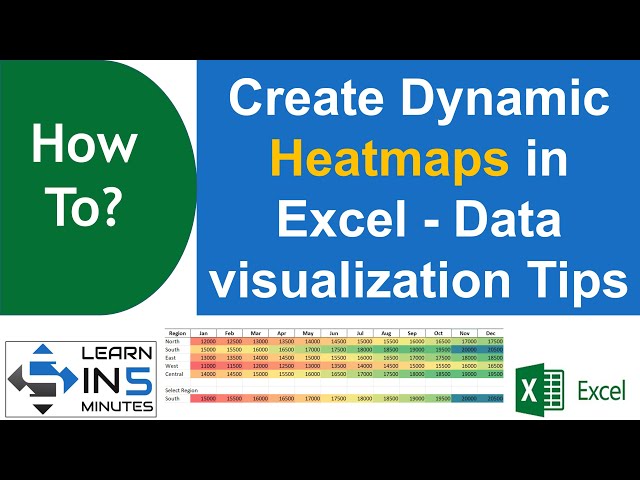
Learn how to create and customize dynamic heat maps in Excel to analyze and visualize your data like a pro! In this tutorial, I'll ...
402 views
Links mentioned in this video ⬇️ Exercise File ...
247,694 views
Mastering Data Visualization: A Comprehensive Guide to Charts in Excel In this episode, we delve into the world of data ...
260 views
Sign up for our Excel webinar, times added weekly: https://www.excelcampus.com/blueprint-registration/ PART 1: ...
15,254,162 views
11 years ago
Excel Data Analysis Full Course Tutorial (7+ Hours) Get Ad-Free Training by becoming a member today!
1,835,310 views
Microsoft Excel just got a game-changing upgrade with Copilot, your AI-powered assistant! In this video, I'll show you how to ...
276,360 views
10 months ago
New course: Learn Python in Excel — already 2500+ enrolled. Solve real data problems, right inside Excel ...
167,235 views
9 months ago
Excel Visualize Your Data Tutorial Get Ad-Free Training by becoming a member today!
14,274 views
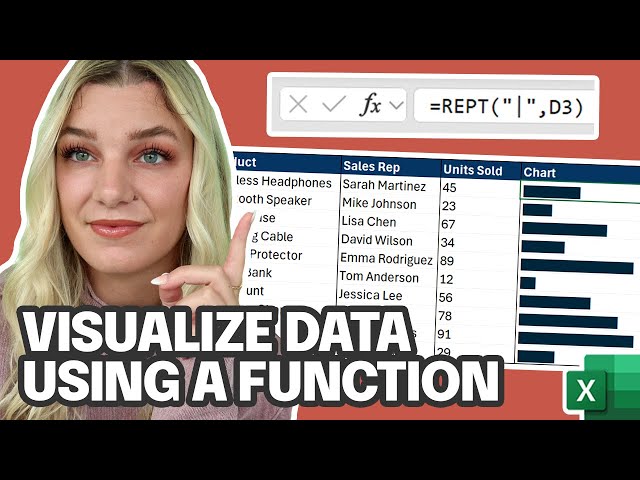
In this video, I show you step-by-step how to turn your data into meaningful insights without using any complicated formulas.
347,469 views
Create charts that wow your audience. Learn the secrets now—start today! https://link.xelplus.com/yt-g-survey-charts-course ...
294,666 views
6 years ago