ViewTube

ViewTube
Sign inSign upSubscriptions
Filters

Upload date

Type

Duration

Sort by

Features

Reset

38,043 results

Chandoo
The Ultimate Excel Dashboard: Visualize Data Like a Pro

OFF My Dashboards Course (code: SAVE50) https://chandoo.org/wp/excel-school-program/ ~ Become an Excel Dashboard ...

29:50
The Ultimate Excel Dashboard: Visualize Data Like a Pro

64,312 views

2 months ago

VBAMacrosAndMore
Visualize Data with Treemap Charts in Excel

Visualize Data with Treemap Charts in Excel Lots more videos here / @vbamacrosandmore4390 How to Create and Use ...

2:37
Visualize Data with Treemap Charts in Excel

82 views

8 months ago

Excel Bootcamp
ChartEngine Add-in for Excel - Data Visualization Tools

ChartEngine is an Excel Chart Add-in that provides stunning data visualizations. Learn more: https://chartengine.io/ A picture tells ...

1:11
ChartEngine Add-in for Excel - Data Visualization Tools

2,161 views

11 months ago

Learn Skills Daily
Excel Visualize Your Data Tutorial

Excel Visualize Your Data Tutorial Get Ad-Free Training by becoming a member today!

50:21
Excel Visualize Your Data Tutorial

13,938 views

10 months ago

Simon Sez IT
How to Create Data Visualization in Excel using Tables, Slicers and Charts (Includes Free Files)

Download the free course files and follow along here: ...

46:13
How to Create Data Visualization in Excel using Tables, Slicers and Charts (Includes Free Files)

2,706 views

2 months ago

Leila Gharani
Python in Excel: The Smarter Way to Use External Data

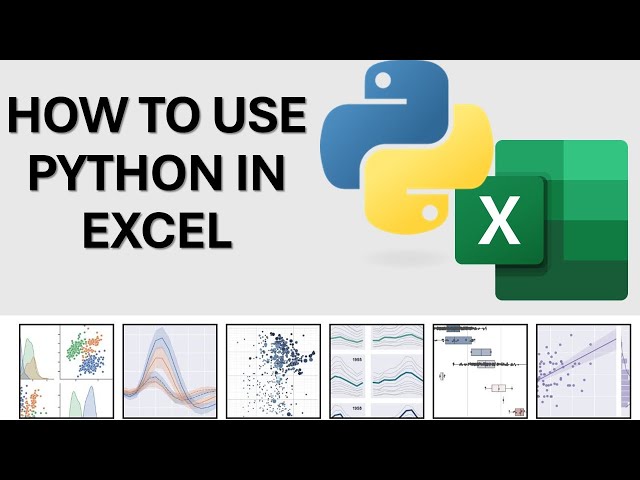
New course: Learn Python in Excel — already 2500+ enrolled. Solve real data problems, right inside Excel ...

10:42
Python in Excel: The Smarter Way to Use External Data

166,067 views

9 months ago

Ms Excel
Create Professional Excel Dashboard in just 10 Minutes || Interactive & Dynamic #excel #dashboard

We're bringing you the best Excel tips and tricks to help you become a spreadsheet expert! Don't forget to hit that like button to ...

13:40
Create Professional Excel Dashboard in just 10 Minutes || Interactive & Dynamic #excel #dashboard

301,581 views

4 months ago

Manus AI
Introducing Data Visualization for Manus

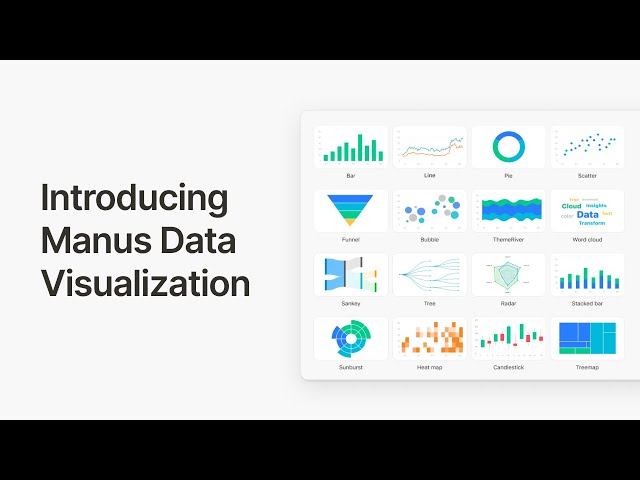
Introducing Data Visualization for Manus! Say goodbye to spreadsheet chaos. Whether you're analyzing competitors, prepping for ...

0:42
Introducing Data Visualization for Manus

16,437 views

6 months ago

Kenji Explains
Create Dashboards in Seconds With AI (It's Mind-Blowing 🤩)

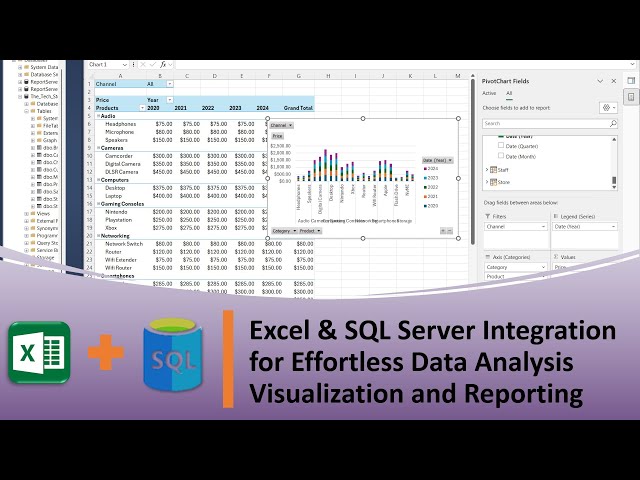
... DOWNLOAD Free Excel file for this video: https://careerprinciples.myflodesk.com/cjuvk76zax In this video, we go over 4 different ...

9:59
Create Dashboards in Seconds With AI (It's Mind-Blowing 🤩)

152,886 views

9 months ago

Reza Dorrani
How to Turn Excel Spreadsheets into Power Apps (2025) | Step-by-Step Beginners Tutorial

In this 2025 Power Apps tutorial, learn how to transform your Excel spreadsheets into fully functional Power Apps — from setup to ...

22:46
How to Turn Excel Spreadsheets into Power Apps (2025) | Step-by-Step Beginners Tutorial

129,525 views

3 months ago

Christine Jiang
Data Storytelling 101 | Think Like a Data Analyst

MENTORSHIP – Applications for the March 2026 cohort are now open! Apply here → https://theanalyticsaccelerator.com/ We're ...

12:55
Data Storytelling 101 | Think Like a Data Analyst

43,988 views

9 months ago

Lanret Academy
DATA VISUALIZATION IN MS EXCEL

DATA VISUALIZATION IN MS EXCEL.

9:53
DATA VISUALIZATION IN MS EXCEL

16 views

7 months ago

Andreas Exadaktylos
How to Build a Habit Tracker Dashboard in Excel (With Checkboxes & Charts!)

Download the COMPLETE workbook: https://bit.ly/43lJu36 Excel Dashboard Course ▶️ https://bit.ly/mellondash Learn how to ...

32:48
How to Build a Habit Tracker Dashboard in Excel (With Checkboxes & Charts!)

22,312 views

8 months ago

career@nook
Master Data Visualisation in Excel (2-Hour Full Tutorial)

Become a Charting Pro in Just 2 Hours! Unlock the full potential of Excel with this comprehensive data visualisation tutorial crafted ...

2:08:47
Master Data Visualisation in Excel (2-Hour Full Tutorial)

131 views

8 months ago

The Wular Academy
PYTHON IN EXCEL: Data Analysis & Visualization with Pandas & Seaborn.

See how Python is transforming Excel into a data powerhouse. In this video, we'll demonstrate: • The groundbreaking PY function ...

22:00
PYTHON IN EXCEL: Data Analysis & Visualization with Pandas & Seaborn.

5,468 views

8 months ago

Rahim Zulfiqar Ali
Create Dashboard / Visuals in Just Few Clicks with Copilot in Excel 365 - Artificial Intelligence

Create Dashboard / Visuals in Just Few Clicks with CoPilot in Excel 365 - Artificial Intelligence #AI #CoPilot #Excel.

3:27
Create Dashboard / Visuals in Just Few Clicks with Copilot in Excel 365 - Artificial Intelligence

7,017 views

9 months ago

Sodit Tech Academy
🚦 Data Visualization in Excel | Create Stunning Dashboards & Charts🚦

Unlock the power of data visualization in Microsoft Excel with this step-by-step tutorial! In this project, I'll walk you through ...

1:25
🚦 Data Visualization in Excel | Create Stunning Dashboards & Charts🚦

35 views

5 months ago

Gurru Tech Solutions
Nano Banana + Gemini 3: AI Data Visualization That Actually Works

Nano Banana + Gemini 3: The Data Visualization Workflow You Need | Stop Making Boring Charts – Use This Nano Banana + ...

10:14
Nano Banana + Gemini 3: AI Data Visualization That Actually Works

23,737 views

1 month ago

ViSIT
Excel & SQL Server Integration: Effortless Data Analysis, Visualization and Reporting

Tired of wrestling with complex SQL queries just to analyze your data? Welcome to this comprehensive tutorial where we'll unlock ...

18:57
Excel & SQL Server Integration: Effortless Data Analysis, Visualization and Reporting

503 views

8 months ago

DR EXCEL
Create an Interactive Dashboard in Excel with US Map | Data Visualization Tutorial

ExcelDashboard #DataVisualization #ExcelTutorialLearn how to create a professional interactive Excel dashboard featuring a ...

14:14
Create an Interactive Dashboard in Excel with US Map | Data Visualization Tutorial

153 views

3 months ago