Upload date
All time
Last hour
Today
This week
This month
This year
Type
All
Video
Channel
Playlist
Movie
Duration
Short (< 4 minutes)
Medium (4-20 minutes)
Long (> 20 minutes)
Sort by
Relevance
Rating
View count
Features
HD
Subtitles/CC
Creative Commons
3D
Live
4K
360°
VR180
HDR
345 results
Are your students struggling with subtraction across the ten? Often, children don't fail at the calculation itself, but at understanding ...
7 views
18 hours ago
... visual mathematics geometry spirals in nature seashell spiral self similarity mathematical beauty math visualization nature ...
0 views
3 days ago
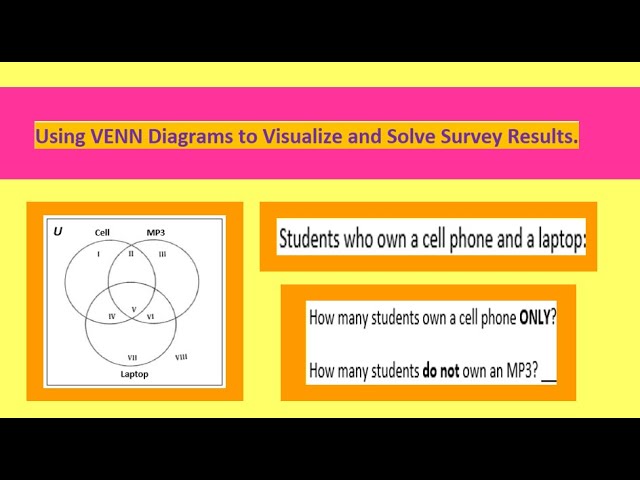
Using VENN Diagrams to Visualize and Solve Survey Results. 1010 UNIT 1 REVIEW EXAM LAST PAGE.
5 days ago
Quiz #09 : Defining Regression Test your understanding of the core definition of regression with this short quiz. This quiz helps ...
6 days ago
Animated Mathematical Visualization** - Uniform Convergence in Action! In this animation, we explore the sequence of functions: ...
1 day ago
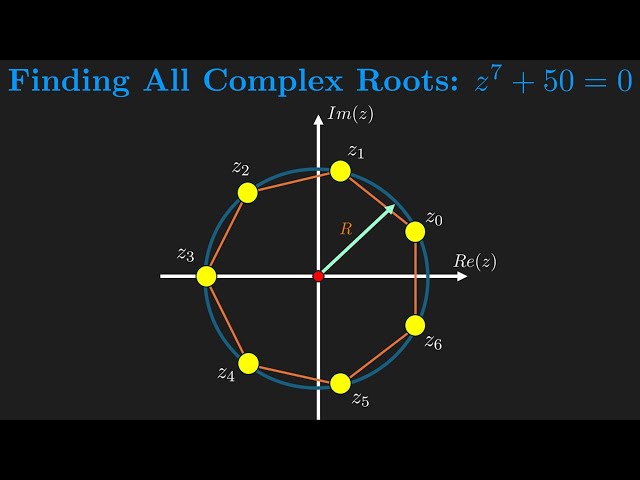
An educational slide presenting the problem of finding all complex roots for the equation z^7+50=0. The layout is structured into ...
24 views
2 days ago
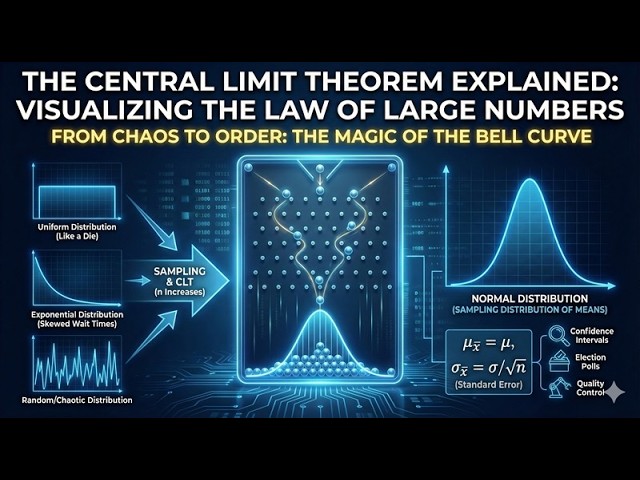
Discover the "Magic" of the Central Limit Theorem (CLT)—the cornerstone of modern statistics and data science. Have you ever ...
57 views
Learn how to visualize and interpret bivariate data using Scatter Plots! In this statistics tutorial, we break down the basics of ...
This video shows a demo of "Flowviz," which is a Python-based tool that can be used for simple vector plots in Python ...
17 views
Understanding Eigenvectors, Eigenvalues, and PCA is one of the biggest roadblocks in Machine Learning and in this video, we ...
29 views
13 hours ago
For 500 years, the world has accepted a fundamentally wrong map. In this video, we use data visualization and geometry to ...
322 views
Can you solve this 200-year-old Japanese geometry puzzle? We have a square containing a large Red Circle, a Semicircle, ...
4 hours ago
Hey folks, in this Blender Tutorial I will show you how to make this trailing squiggle spline into an audio visualizer using geometry ...
152 views
Redis CEO Rowan Trollope introduces Redis 8 Vector Sets — a new data type for storing, searching, and experimenting with ...
130 views
... a staircase surrounded by mathematical visualizations, including fractals, binary code, parametric plots, and waveform patterns.
Learning Goals - Main Objective: - Side Quest 1: --- ⏱️Video Timestamps 00:00 Intro 00:25 Basic Area Formula Reminder ...
127 views
... core capabilities, including advanced image editing, a robust animation engine, and integrated mathematical visualization tools.
45 views
Confused by Standard Deviation? You're not alone! In this beginner-friendly statistics tutorial, we break down exactly what ...
4 views
[Section 1: English Hook & Context] Does 4-bit quantization make a model stupid? We put **Qwen 2.5 7B (Int4)** to the ultimate ...
20 views
Get ready to rap, learn, and LEVEL UP your math skills! In Percent Power Jam, Plain Jane breaks down percentages with an ...