Upload date
All time
Last hour
Today
This week
This month
This year
Type
All
Video
Channel
Playlist
Movie
Duration
Short (< 4 minutes)
Medium (4-20 minutes)
Long (> 20 minutes)
Sort by
Relevance
Rating
View count
Features
HD
Subtitles/CC
Creative Commons
3D
Live
4K
360°
VR180
HDR
636 results
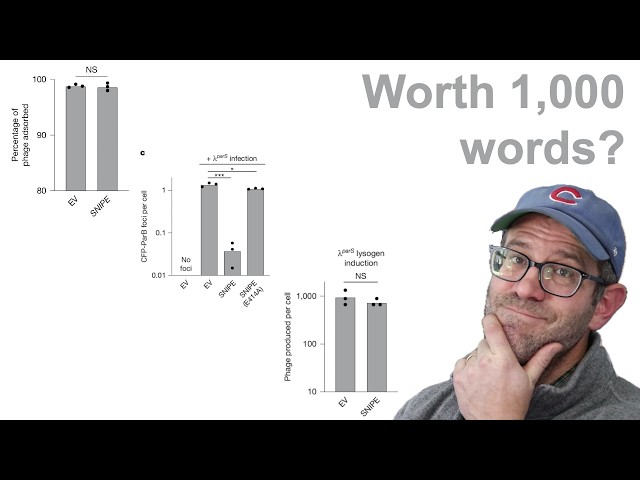
Pat critiques a set of panels from a figure published in the scientific journal Nature looking at a novel mechanism of defense used ...
0 views
10 hours ago
... This online Data Science course equips you with end-to-end skills—from Python refresher, SQL, Data visualization to advanced ...
2,136 views
22 hours ago
Learn how to create a 3D bar chart in Excel quickly and professionally in this step-by-step tutorial. In this video, you will discover ...
23 minutes ago
0
... Stacked Bar Chart 05:45 Line Chart 06:49 Scatter Plot 07:39 Bonus Charts #datavisualization #datanalytics #datascience.
42 views
23 hours ago
One of the exciting additions to Microsoft Fabric is the Map Item which enables teams to visualize and analyze geospatial data ...
50 views
13 hours ago
Data visualization is one of the most powerful ways to understand complex datasets. In this video, we explore how aicuflow ...
9 views
15 hours ago
Learn about data analysis, data visualization, data interpretation, and the role of data analysts in modern business, technology, ...
21 hours ago
... host Q & A sessions, inspiring others to improve their skills and embrace the power of data visualization, both off- and online.
20 views
7 hours ago
... professional certificates that teach the core skills every data analyst needs: Excel, SQL, Python, data visualization, and statistics.
I also share Tableau training, dashboard design tips, and practical analytics lessons to help you improve your data visualization ...
12 hours ago
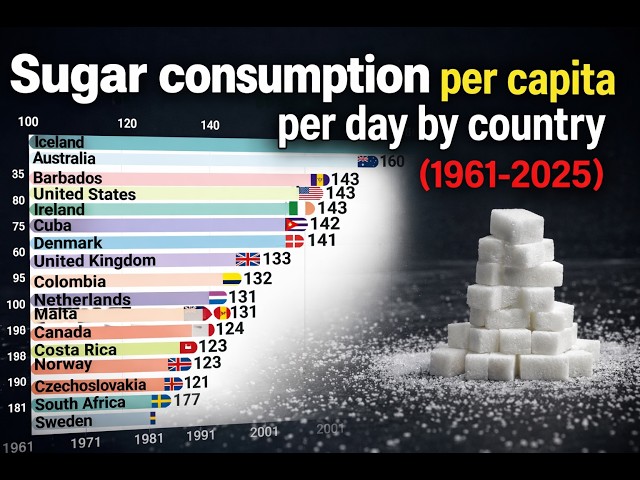
Discover how sugar consumption per capita changed by country from 1961 to 2025 in this data visualization and bar chart race.
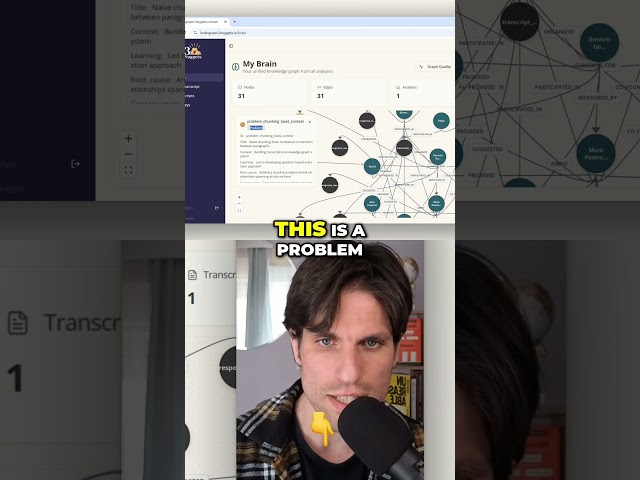
Navigate complex data relationships effortlessly. Visualize connections and understand context like never before with powerful ...
4 hours ago
Whether you're using Excel 365, Excel 2021, or an older version, these steps will help you master data visualization in seconds.
17 hours ago
In this video, I explain the most important tools used in data analysis, including Excel, SQL, Python, and data visualization tools ...
7 views
8 hours ago
Somali Network Classroom waa maxhad E-waxbarasho ah oo aad ku baranayso Cilmiga Networking iyo CyberSecurity.
40 views
3 hours ago
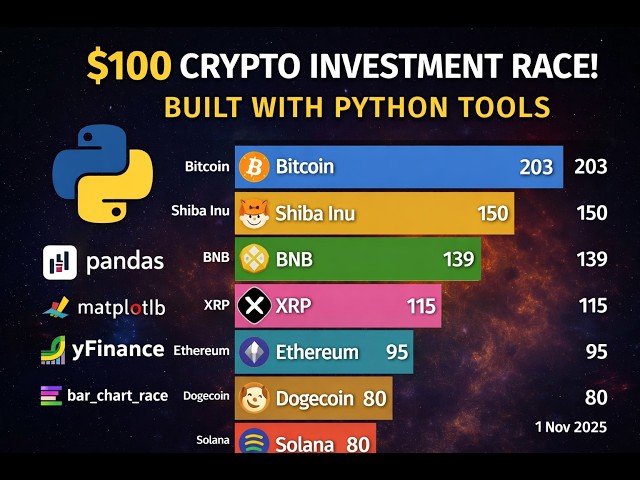
This animated bar chart race was built entirely using Python, combining financial data analysis with data visualization and video ...
14 hours ago
This clean and satisfying data visualization makes it easy to compare military spending around the world and highlights the ...
27 views
R remains one of the most powerful programming languages for data science, statistics, machine learning, and advanced ...
Power BI Introduction | Beginner's Guide to Data Visualization / Data Engineering #dataengineering #dataengineer #freelearning ...
6 hours ago