Upload date
All time
Last hour
Today
This week
This month
This year
Type
All
Video
Channel
Playlist
Movie
Duration
Short (< 4 minutes)
Medium (4-20 minutes)
Long (> 20 minutes)
Sort by
Relevance
Rating
View count
Features
HD
Subtitles/CC
Creative Commons
3D
Live
4K
360°
VR180
HDR
76,546 results
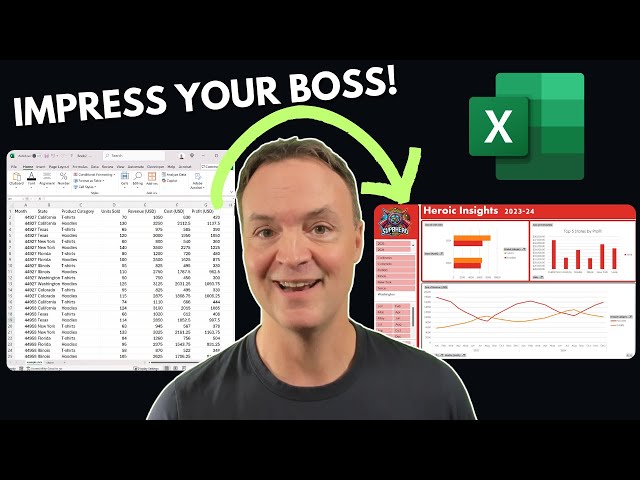
Learn Data Analysis Essentials in Excel in Just 12 minutes! Take our Data Analyst Program here: ...
153,085 views
11 months ago
OFF My Dashboards Course (code: SAVE50) https://chandoo.org/wp/excel-school-program/ ~ Become an Excel Dashboard ...
55,719 views
2 months ago
Ready to transform your spreadsheets from ordinary to extraordinary? In this tutorial, you'll learn how to take raw, unorganized ...
102,828 views
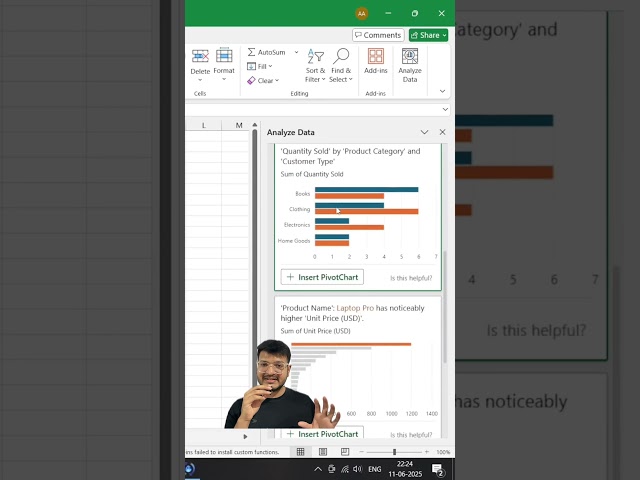
Did you know now you can use AI in Excel to analyze this data just convert it into a table using CtrlT head over to analyze data in ...
189,291 views
6 months ago
Excel Visualize Your Data Tutorial Get Ad-Free Training by becoming a member today!
13,575 views
9 months ago
Want to visualize and filter data in Excel like a pro? In this tutorial, I'll show you how to easily create a table, insert a column chart, ...
3,224 views
ChartEngine is an Excel Chart Add-in that provides stunning data visualizations. Learn more: https://chartengine.io/ A picture tells ...
2,133 views
10 months ago
Download the free course files and follow along here: ...
2,640 views
Nano Banana + Gemini 3: The Data Visualization Workflow You Need | Stop Making Boring Charts – Use This Nano Banana + ...
23,274 views
1 month ago
See how Python is transforming Excel into a data powerhouse. In this video, we'll demonstrate: • The groundbreaking PY function ...
5,176 views
7 months ago
In this video, create a dynamic excel chart to visualize data using filter function. #excel #exceltips #exceltutorial #learnexcel ...
1,074 views
Explore stunning Excel dashboard examples designed for clear and effective data visualization. See how charts, graphs, and ...
1,087 views
3 Excel Tips for Stunning Data Visualization | Make Charts & Graphs Like a Pro Download our app: https://play.google.com ...
24,963 views
3 months ago
Excel Map Chart Trick You Didn’t Know! 💡 | State-wise Sales 🚀 Learn Excel in Hindi – Only ₹99 🔥 Join here 👉 https ...
440,690 views
Unlock the power of data visualization in Microsoft Excel with this step-by-step tutorial! In this project, I'll walk you through ...
35 views
5 months ago
8 views
8 months ago
Top three data visualization tips you need to know Spark lines are mini line charts that are entered directly inside your cells.
23,074 views
Create stunning 3D graphs directly in Excel using XYZ Mesh! This tutorial shows you step-by-step how to transform simple XYZ ...
1,211 views
Data Visualization Assignment – Tourism Dataset Analysis in Excel In this video, I use Microsoft Excel to analyze tourism data ...
106 views
How to Create Dynamic Target vs Actual Chart in Excel | Excel Data Visualization Tutorial #SD79 In this video, you'll learn how to ...
14,890 views