Upload date
All time
Last hour
Today
This week
This month
This year
Type
All
Video
Channel
Playlist
Movie
Duration
Short (< 4 minutes)
Medium (4-20 minutes)
Long (> 20 minutes)
Sort by
Relevance
Rating
View count
Features
HD
Subtitles/CC
Creative Commons
3D
Live
4K
360°
VR180
HDR
22,023 results
To learn for free on Brilliant, go to https://brilliant.org/techwithtim . Brilliant's also given our viewers 20% off an annual Premium ...
7,128 views
10 days ago
Register for Intellipaat's Premium Data Science Course: https://intellipaat.com/data-scientist-course-training/ Access the ...
91,206 views
7 months ago
python #coding #matplotlib This video serves as an introduction to the Matplotlib Python library. We'll cover the basics of ...
77,707 views
3 months ago
python #coding #matplotlib Matplotlib is a Python library used for data visualization. It provides a MATLAB-like interface for quick ...
24,059 views
4 months ago
Our favourite plotting library may just be matplotlib again now that we made it interactive with a puck! It may sounds strange at first, ...
6,261 views
6 days ago
Master Matplotlib for your next data science interview! This comprehensive tutorial covers everything you need to know about ...
162 views
Master AI from Zero to Advanced: https://ailearninghub.io ------------------------- In this video, you'll learn the fundamentals of creating ...
817 views
10 months ago
If you appreciate the content and the hard work, Please subscribe - https://www.youtube.com/@KeertiPurswani ...
21,371 views
11 months ago
Masters In Data-Analytics with GenAI with Job Guarantee Program - https://codingwise.in/program/data-analytics Python for Data ...
212,100 views
9 months ago
Master AI from Zero to Advanced: https://ailearninghub.io ------------------------- In this video, you'll learn how to create and customize ...
181 views
Matplotlib Python Tutorial for Beginners | Data Visualization in Python Matplotlib is a python library used for data ...
5,433 views
python #coding #matplotlib In this video I will show you how to create subplots using Matplotlib.
7,757 views
Welcome to the Complete Data Visualization in Python Course! In this full video tutorial, we're diving deep into the world of ...
90,063 views
8 months ago
In this beginner-friendly tutorial, we walk through how to create line charts, scatter plots, and box plots using the powerful ...
1,280 views
Python Code: import matplotlib.pyplot as plt x = [1, 2, 3, 4, 5] y = [1, 4, 9, 16, 25] plt.plot(x, y, linewidth=3, marker='+', color='green') ...
12,084 views
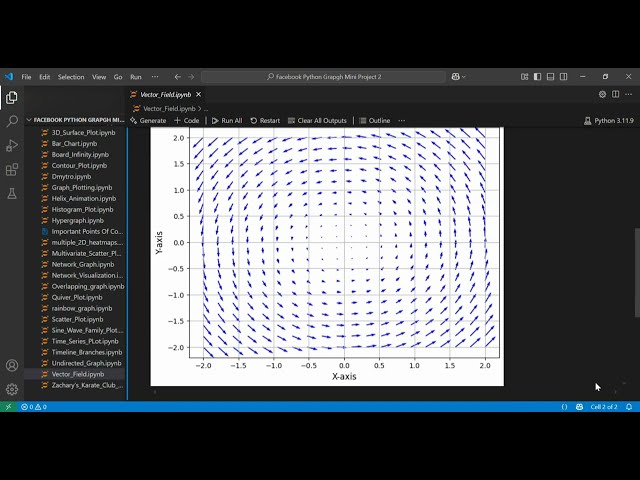
2D Vector Field Visualization in Python | Matplotlib & NumPy Tutorial In this tutorial, learn how to create and visualize a 2D vector ...
78 views
python #coding #matplotlib In this video we will create a basic scatter plot using Matplotlib. Here is some sample data you can ...
6,819 views
python #coding #matplotlib This video will give you an introduction to customizing plots with Matplotlib. In the next video, we will ...
8,471 views
Create Amazing Animated Scatter Plots in Python | Matplotlib Animation Tutorial Bring your data to life! In this Python tutorial, I'll ...
71 views
5 months ago
Valentine's Day Coding Project**: Learn to create a personalized animated heart using Python (Matplotlib/NumPy) and share it as ...
735 views