Upload date
All time
Last hour
Today
This week
This month
This year
Type
All
Video
Channel
Playlist
Movie
Duration
Short (< 4 minutes)
Medium (4-20 minutes)
Long (> 20 minutes)
Sort by
Relevance
Rating
View count
Features
HD
Subtitles/CC
Creative Commons
3D
Live
4K
360°
VR180
HDR
82 results
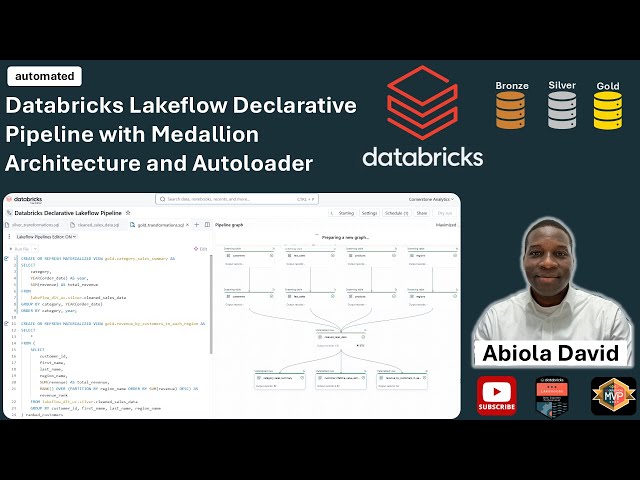
In this video, I covered how to create multi-page AI/BI dashboard in databricks leverating unity catalog data. If you like this video, ...
2,966 views
1 year ago
This video shows how to visualize query in Databricks Notebook. #Databricks #AzureDatabricks #VisualizationTechniques.
1,431 views
What is Databricks? A Detailed Explanation of Databricks and Its Core Concepts Are you curious about Databricks, the powerful ...
296 views
In this end-to-end high-level data engineering video, I will show you how to architecture scalable and high-performance ...
6,513 views
5 months ago
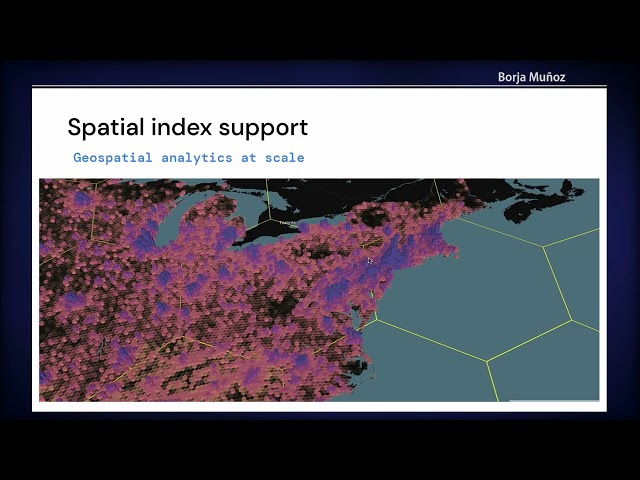
In this talk, we'll review the major milestones that have defined Spatial SQL as the powerful tool for geospatial analytics that it is ...
14 views
Take my Full Python Course Here: https://www.analystbuilder.com/courses/pandas-for-data-analysis In this series we will be ...
114,812 views
2 years ago
Create professional cloud architecture diagrams automatically using AI, Python, and GitHub Copilot — completely free.
81,385 views
2 months ago
In this video, I show how to use MLflow (https://mlflow.org) with the Transformers library, and why it's a good idea to store the logs ...
9,315 views
3 years ago
Teaser for Tasks, Techniques, and Tools for Genomic Data Visualization State of the Art (STAR) report: ...
130 views
6 years ago
Joseph Bradley, Software Engineer, Databricks, talks with George Gilbert at the Databricks Innovation Day in San Francisco, CA.
452 views
9 years ago
My Courses on Linkedin Learning: https://www.linkedin.com/learning/instructors/tim-ngwena Boost your skills with DataCamp's ...
636 views
01. Jason Scheller, Eyeview, visits theCUBE!. (00:19) 02. Background of Eyeview. (00:57) 03. Indicators of the Spark Impact on ...
561 views
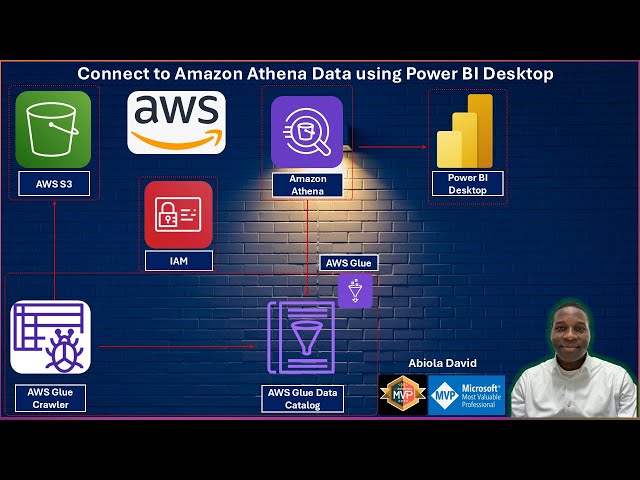
In this new video, I show you how to leverage Power BI Desktop to connect to Amazon Athena Data to build reports. You'll learn ...
1,242 views
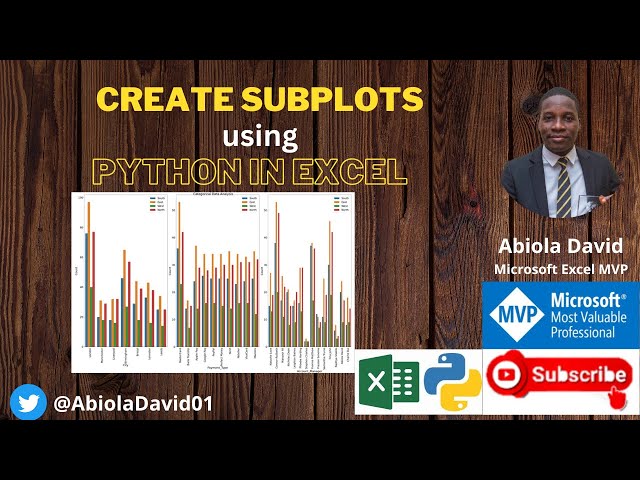
This second video demo how to create subplots using Python in Excel #Excel #PythonInExcel Python Code df = xl("A2:J1041", ...
540 views
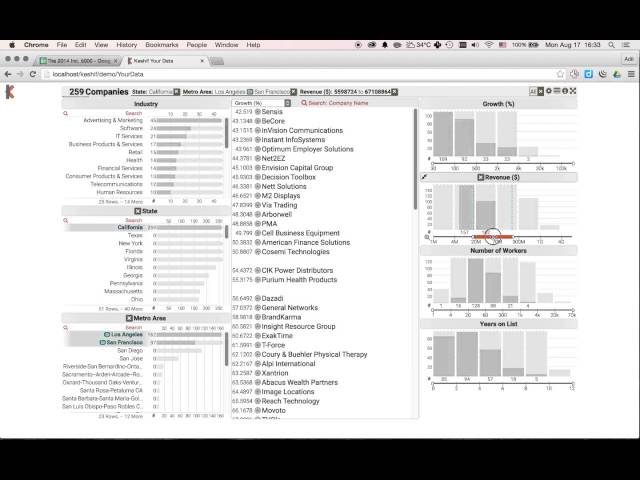
With Keshif, you can explore and understand your data - interactively, visually & easily on the web. What did you like in this video?
6,718 views
8 years ago
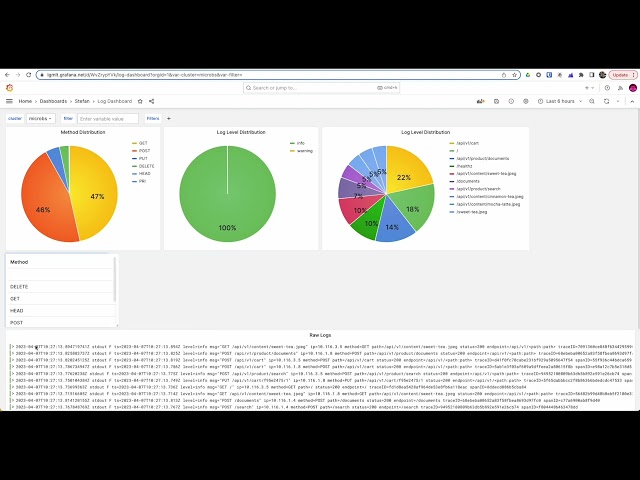
Are you new to Grafana or Grafana Loki or both, then this video is for you. It shows you how to implement a log dashboard in a few ...
49,498 views
NEUBIAS Academy webinar - 9 February, 2021 keywords: Fiji, OpenMPI, HPC, IJ2 Ops commands, ImgLib2, N5, Spark, BDV, ...
832 views
4 years ago
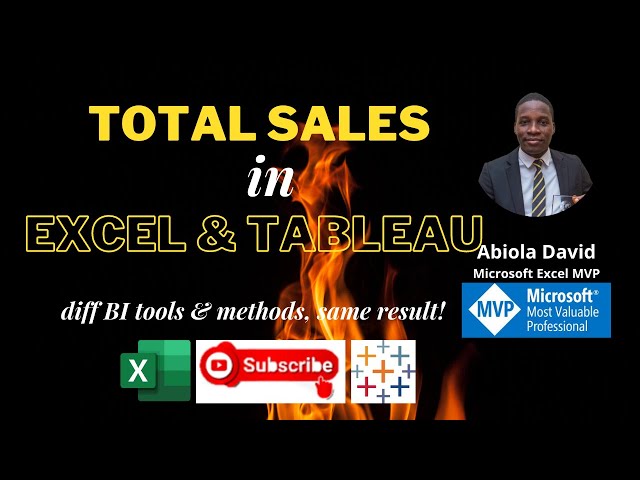
In this video tutorial, we looked at using Excel and Tableau BI technologies to calculate Total Sales. If you enjoy this video, hit the ...
710 views
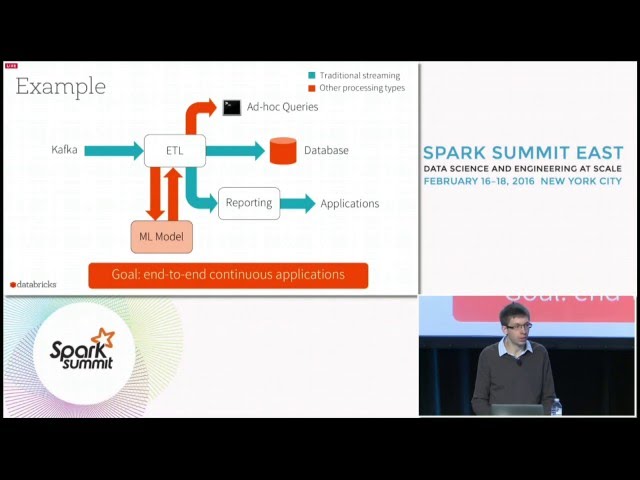
How Spark use-cases are transforming data | #SparkSummit by Teryn O'Brien | Feb 23, 2016 How is Apache Spark, an engine for ...
5,019 views
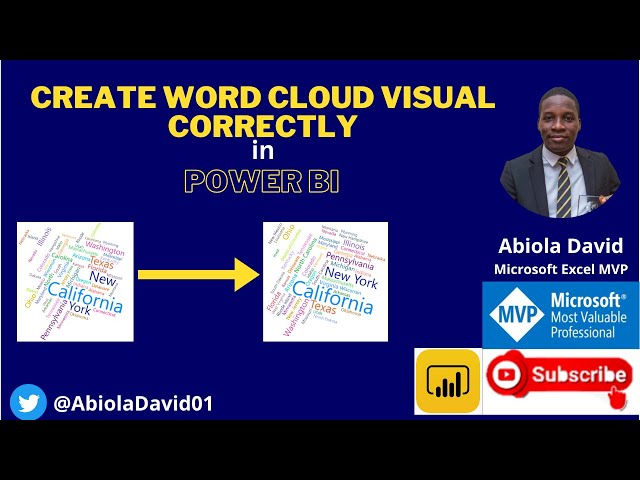
In this video, I demonstrated how to Create Word Cloud Visual Correctly in Power BI #powerbi.
2,525 views