ViewTube

ViewTube
Sign inSign upSubscriptions
Filters

Upload date

Type

Duration

Sort by

Features

Reset

3,222 results

Tech With Tim
Learn Matplotlib in 30 Minutes - Python Matplotlib Tutorial

To learn for free on Brilliant, go to https://brilliant.org/techwithtim . Brilliant's also given our viewers 20% off an annual Premium ...

30:51
Learn Matplotlib in 30 Minutes - Python Matplotlib Tutorial

8,999 views

2 weeks ago

marimo
matplotlib, made interactive.

Our favourite plotting library may just be matplotlib again now that we made it interactive with a puck! It may sounds strange at first, ...

12:08
matplotlib, made interactive.

6,546 views

2 weeks ago

Maven Analytics
Learn Python: Create Simple & Clear Data Visualizations with Matplotlib

Visualizing data helps you understand it faster, and Matplotlib is one of the best Python tools for making charts. In this video, Lead ...

9:43
Learn Python: Create Simple & Clear Data Visualizations with Matplotlib

1,465 views

8 days ago

marimo
You can now select points in matplotlib charts

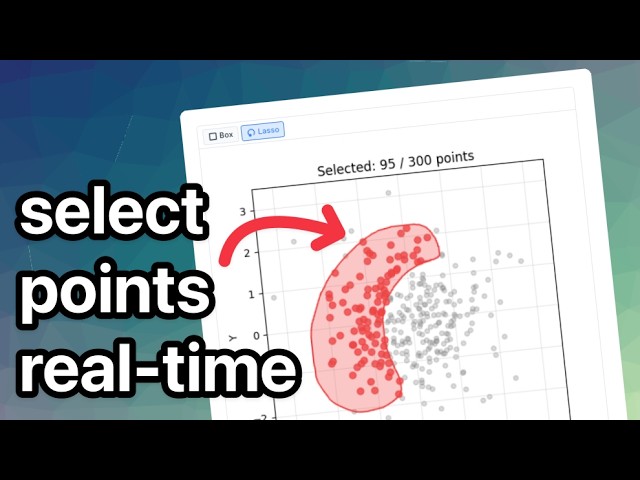
When we made the first interactive PuckChart we didn't realize that a box/lasso utility on a scatter chart would be a better idea.

5:19
You can now select points in matplotlib charts

1,524 views

2 days ago

Rishabh Mishra
Matplotlib Python Tutorial for Beginners | Data Visualization in Python

Matplotlib Python Tutorial for Beginners | Data Visualization in Python Matplotlib is a python library used for data ...

39:20
Matplotlib Python Tutorial for Beginners | Data Visualization in Python

8,384 views

2 weeks ago

NeuralNine
Seaborn Crash Course - Data Visualization in Python

This video today is a crash course on Seaborn, a data visualization library for Python built on top of Matplotlib. It makes it super ...

35:56
Seaborn Crash Course - Data Visualization in Python

6,477 views

1 month ago

Yellow Sunflower
Fonts in matplotlib made ridiculously simple with pyfonts

Become a data visualization expert with a 30% discount: https://www.matplotlib-journey.com/ Pyfonts is a Python package that ...

2:20
Fonts in matplotlib made ridiculously simple with pyfonts

137 views

3 weeks ago

Jakubication
How To Install matplotlib in Python 3.14.3

This video shows how to install matplotlib on Python 3.14.3 It will walk you through, step-by-step, how to install matplotlib on ...

2:38
How To Install matplotlib in Python 3.14.3

17 views

8 days ago

PyPlus
How to Create a Stacked Area Plot Using Python | Matplotlib Visualization

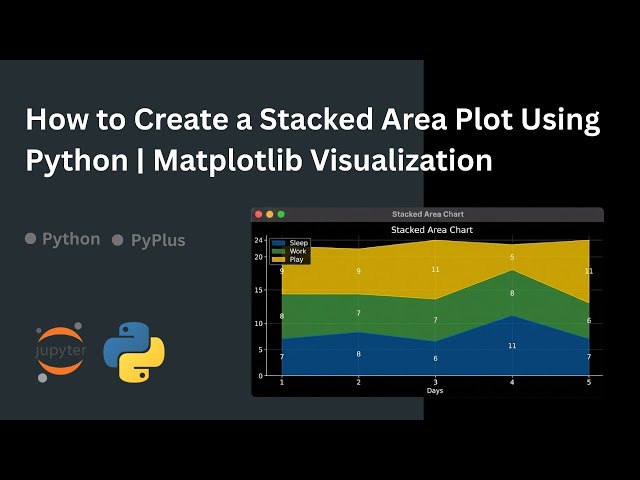
What is a stacked area plot and how can you create one using Python? In this video, you'll learn how to visualize multiple ...

1:37
How to Create a Stacked Area Plot Using Python | Matplotlib Visualization

1 view

2 weeks ago

PySec Intellegence
Matplotlib Complete Course | Create Stunning Visualizations in Python

Master Data Visualization with Python's Most Powerful Library! Perfect for students, beginners, and aspiring data scientists.

1:01:08
Matplotlib Complete Course | Create Stunning Visualizations in Python

45 views

8 days ago

PyPlus
How to Visualize Circular Wave Superposition Using Python | Matplotlib & NumPy

What happens when circular waves overlap? In this video, you'll see how to visualize circular wave superposition using Python ...

2:03
How to Visualize Circular Wave Superposition Using Python | Matplotlib & NumPy

0 views

3 weeks ago

Learning Pines
How to Import Matplotlib in Jupyter Notebook (easy Method)

How to Import Matplotlib in Jupyter Notebook (easy Method) | Surfshark VPN Deal — Stay private and secure. $1.99/mo + 3 ...

1:45
How to Import Matplotlib in Jupyter Notebook (easy Method)

3 views

12 days ago

PyPlus
How to Draw the Google Logo Using Python | Matplotlib Text Art

What if you could draw the Google logo using Python? In this video, you'll learn how to create a colorful Google-style text ...

4:13
How to Draw the Google Logo Using Python | Matplotlib Text Art

0 views

2 weeks ago

The Debug Zone
Matplotlib's autoscale doesn't seem to work on y axis for small values?

Today's Topic: Matplotlib's autoscale doesn't seem to work on y axis for small values? Thanks for taking the time to learn more.

1:22
Matplotlib's autoscale doesn't seem to work on y axis for small values?

2 views

12 days ago

Anahata Intelligence
Boxplot & scatterplot in Python libraries using matplotlib
14:59
Boxplot & scatterplot in Python libraries using matplotlib

2 views

2 weeks ago

Anahata Intelligence
Scatter plot using matplotlib python library
10:15
Scatter plot using matplotlib python library

4 views

2 weeks ago

Code Swanky
8. Bioinformatics with Python: Visualizing GC Content with Matplotlib

Data is only as good as your ability to communicate it! In this video, we step away from the terminal and into the world of data ...

10:09
8. Bioinformatics with Python: Visualizing GC Content with Matplotlib

57 views

11 days ago

Anahata Intelligence
Matplotlib python library
13:40
Matplotlib python library

4 views

2 weeks ago

Hafiz Muhammad Naveed
Sales Performance Analysis for Small Business using Python (Pandas and matplotlib)

Welcome to Python Projects for Everyone! On this channel, we learn Python step by step through real-world examples — in a ...

21:30
Sales Performance Analysis for Small Business using Python (Pandas and matplotlib)

10 views

7 days ago

Dr Owen Mtambo's Maths, Statistics & Computing
Data Visualization Part 2 | Pandas, NumPy, Matplotlib & Seaborn

DataVisualization #PythonDataVisualization #Python #Matplotlib #Seaborn #Pandas #NumPy #DataScience #DataAnalysis ...

1:17:56
Data Visualization Part 2 | Pandas, NumPy, Matplotlib & Seaborn

1,865 views

11 days ago