Upload date
All time
Last hour
Today
This week
This month
This year
Type
All
Video
Channel
Playlist
Movie
Duration
Short (< 4 minutes)
Medium (4-20 minutes)
Long (> 20 minutes)
Sort by
Relevance
Rating
View count
Features
HD
Subtitles/CC
Creative Commons
3D
Live
4K
360°
VR180
HDR
58 results
How to plot vector addition in Matplotlib? Helpful? Please use the *Thanks* button above! Or, thank me via Patreon: ...
32 views
8 hours ago
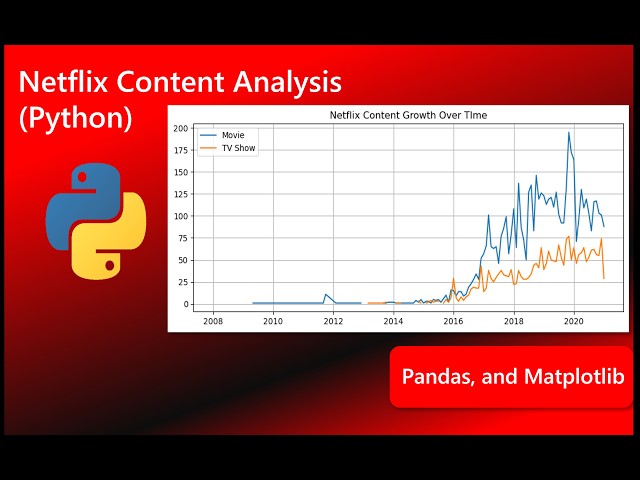
In this project, I analyze a real Netflix dataset using Python, Pandas, and Matplotlib to answer practical business questions and ...
7 views
9 hours ago
Detailed Syllabus On Official 5 Minutes Engineering Whatsapp Channel ...
90 views
5 hours ago
In this video, learn to download and install Python 3.14.3 on Windows 10. We will also run a sample Python code. Python Tutorial ...
109 views
In this step-by-step Python tutorial, we calculate and plot the full titration curve of acetic acid using real acid–base data from a CSV ...
13 views
1 day ago
I'm finally back! After a few days of dealing with a major software crash that affected a lot of small creators, I've fixed my setup ...
3 views
Principles and Practices of Effective Data Visualization This presentation provides a comprehensive overview of data visualization ...
2 views
21 hours ago
In this video, I walk you through a complete end-to-end data analytics project where I analyze global happiness trends from 2015 ...
5 views
PFDS: Week 2 ============== Pandas dataframe and dataframe-related operations - Reading files - Exploratory data analysis ...
0 views
Welcome to the official Python & Data Analytics Internship by SAS Foundation — an NGO empowering youth through education ...
Para ser avisado das lives semanais, increva-se aqui: https://lp.hashtagtreinamentos.com/python/live/inscricao?fonte=org ...
3,358 views
Streamed 23 hours ago
MIT 6.7960 Deep Learning, Fall 2024 Instructor: Jamie Meindl View the complete course: ...
24 views
2 hours ago
9 views
pyplot.text() on a boxplot without a y coordinate position Helpful? Please use the *Thanks* button above! Or, thank me via ...
13 hours ago
In this quick and easy Python tutorial, learn how to create a smooth sine wave plot using Matplotlib and NumPy. Perfect for ...
Description In this video, we continue our Artificial Neural Network (ANN) journey and learn how neural networks learn using ...
20 hours ago
Principios y Prácticas de la Visualización de Datos Efectiva Esta presentación ofrece una visión general completa de la ...
17 views
The Speech-to-Text Converter tool in Python converts spoken audio into readable text, supporting multilingual speech such as ...
4 hours ago
Join our hands-on Artificial Intelligence Course at AI Codes Institute — designed for beginners, students, and anyone who wants ...
12 views
Streamed 25 minutes ago
What is the right way to plot a histogram in python using pyplot? Helpful? Please use the *Thanks* button above! Or, thank me via ...
19 views
16 hours ago


![Como Automatizar TUDO com Python [Projeto Prático]](/api/proxy/image?url=https%3A%2F%2Fi.ytimg.com%2Fvi%2FJjwWQ9H9st0%2Fsddefault.jpg)