Upload date
All time
Last hour
Today
This week
This month
This year
Type
All
Video
Channel
Playlist
Movie
Duration
Short (< 4 minutes)
Medium (4-20 minutes)
Long (> 20 minutes)
Sort by
Relevance
Rating
View count
Features
HD
Subtitles/CC
Creative Commons
3D
Live
4K
360°
VR180
HDR
39,244 results
Take my Full Excel for Data Analytics Course! https://www.analystbuilder.com/courses/excel-for-data-analytics In this video we ...
1,169,556 views
3 years ago
Simple techniques - using Excel and other tools - can help you to visualize data and present information clearly and effectively.
42 views
9 years ago
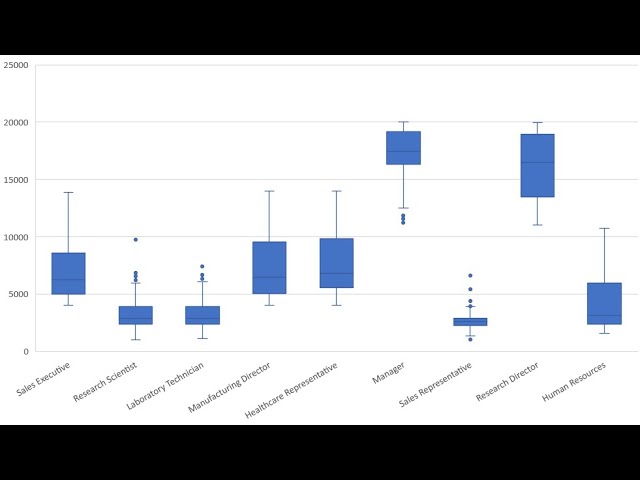
In this video I demonstrate how to create a boxplot using Microsoft Excel 365.
76,360 views
6 years ago
Take my Full Excel Course Here: https://www.analystbuilder.com/courses/excel-for-data-analytics Download Datasets: ...
123,627 views
1 year ago
In this Microsoft Excel tutorial, you'll learn how to make great data visualizations in Excel. Learn and master the art of creating a ...
399 views
Take my Full Excel for Data Analytics Course! https://www.analystbuilder.com/courses/excel-for-data-analytics Excel is one of the ...
1,178,593 views
4 years ago
778,924 views
In Ms excel you can Interactive Dashboard in Ms Excel | Data Visualization in Ms Excel | Create Dashboard in Excel Ease, we ...
127 views
Check out my Full Tableau Course Here: https://www.analystbuilder.com/courses/tableau-for-data-visualization This is our first of ...
968,936 views
588,674 views
Check out all my Full Courses on Analyst Builder: https://www.analystbuilder.com/ 25% Off Analyst Builder Code: BOOTCAMP In ...
960,842 views
If you're processing survey data that includes scales from strongly agree to strongly disagree, or similar, you probably want to plot ...
72,830 views
SARA Institute was founded in April 2023 by Dr. Ajay Kumar Koli & Dr. Kiran Lata. How to Donate to SARA: UPI ID: ...
34 views
6 months ago


![Ultimate Data Analyst Bootcamp [24 Hours!] for FREE | SQL, Excel, Tableau, Power BI, Python, Azure](/api/proxy/image?url=https%3A%2F%2Fi.ytimg.com%2Fvi%2FwQQR60KtnFY%2Fsddefault.jpg)