ViewTube

ViewTube
Sign inSign upSubscriptions
Filters

Upload date

Type

Duration

Sort by

Features

Reset

425 results

marimo
matplotlib, made interactive.

Our favourite plotting library may just be matplotlib again now that we made it interactive with a puck! It may sounds strange at first, ...

12:08
matplotlib, made interactive.

6,314 views

7 days ago

Maven Analytics
Learn Python: Create Simple & Clear Data Visualizations with Matplotlib

Visualizing data helps you understand it faster, and Matplotlib is one of the best Python tools for making charts. In this video, Lead ...

9:43
Learn Python: Create Simple & Clear Data Visualizations with Matplotlib

243 views

5 hours ago

Rishabh Mishra
Matplotlib Python Tutorial for Beginners | Data Visualization in Python

Matplotlib Python Tutorial for Beginners | Data Visualization in Python Matplotlib is a python library used for data ...

39:20
Matplotlib Python Tutorial for Beginners | Data Visualization in Python

5,927 views

7 days ago

PyPlus
How to Draw the Google Logo Using Python | Matplotlib Text Art

What if you could draw the Google logo using Python? In this video, you'll learn how to create a colorful Google-style text ...

4:13
How to Draw the Google Logo Using Python | Matplotlib Text Art

0 views

6 days ago

TheKnowledgeBase
matplotlib.pyplot.axes() arguments confusion

tech,tech news,best tech,cheap tech,tech gifts,weird tech,tech fails,ces 2025 tech,ces tech,big tech,dog tech,new tech,top tech ...

1:04
matplotlib.pyplot.axes() arguments confusion

0 views

5 days ago

Code Swanky
8. Bioinformatics with Python: Visualizing GC Content with Matplotlib

Data is only as good as your ability to communicate it! In this video, we step away from the terminal and into the world of data ...

10:09
8. Bioinformatics with Python: Visualizing GC Content with Matplotlib

57 views

4 days ago

Priyanshi Rathore
Matplotlib Full Course in 1 Shot | Amazon Dataset Project | Data Visualization for Data Science & ML

AI, ML & Python — Job Ready Course ...

2:39:32
Matplotlib Full Course in 1 Shot | Amazon Dataset Project | Data Visualization for Data Science & ML

188 views

6 days ago

Bagupadadham
Data Visualization Explained Simply | Matplotlib

In this video, we explain What is Data Visualization in a very simple way using real-life examples. You will understand why tables ...

2:43
Data Visualization Explained Simply | Matplotlib

7 views

6 days ago

Dr Owen Mtambo's Maths, Statistics & Computing
Data Visualization Part 2 | Pandas, NumPy, Matplotlib & Seaborn

DataVisualization #PythonDataVisualization #Python #Matplotlib #Seaborn #Pandas #NumPy #DataScience #DataAnalysis ...

1:17:56
Data Visualization Part 2 | Pandas, NumPy, Matplotlib & Seaborn

500 views

4 days ago

dylan rainbolt ⚡
Python: Visualizing EV Trends by Model Using Pandas and Matplotlib

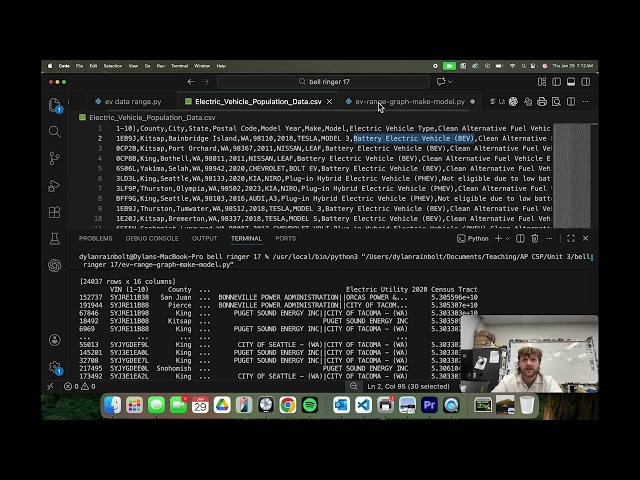
CSV Data can be found here: https://catalog.data.gov/dataset/electric-vehicle-population-data.

9:11
Python: Visualizing EV Trends by Model Using Pandas and Matplotlib

39 views

6 days ago

TechnoDen0
Plotting with matplotlib part1

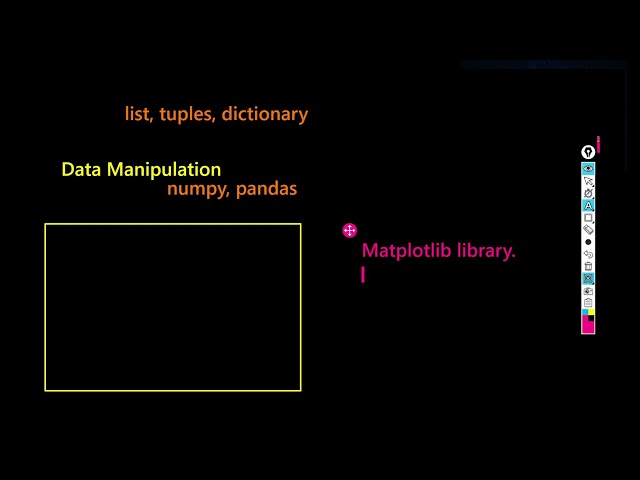
This video is introductory video of plotting the graphs using matplotlib library.

12:59
Plotting with matplotlib part1

0 views

6 days ago

Tiv Noel
python matplotlib graph/smooth/line/vscode

coding a graph in python using scipy/matplotlib/numpy/ smooth wave graph with array and #python #matplotlib ...

16:01
python matplotlib graph/smooth/line/vscode

7 views

6 days ago

The Debug Zone
Matplotlib's autoscale doesn't seem to work on y axis for small values?

Today's Topic: Matplotlib's autoscale doesn't seem to work on y axis for small values? Thanks for taking the time to learn more.

1:22
Matplotlib's autoscale doesn't seem to work on y axis for small values?

1 view

4 days ago

Quantsoft Academy
Numpy, Pandas, Matplotlib | Python Libraries

In this video, Numpy, Pandas, Matplotlib | Python Libraries, we cover the three most important Python libraries used in trading, ...

13:51
Numpy, Pandas, Matplotlib | Python Libraries

0 views

7 days ago

Roboduino
How to Install Python Libraries ( OpenCV, MediaPipe & Matplotlib ) 🖥️✨ Step-by-Step

In this video, I show how to install Python libraries step by step, including OpenCV, MediaPipe, and Matplotlib, without confusion ...

4:59
How to Install Python Libraries ( OpenCV, MediaPipe & Matplotlib ) 🖥️✨ Step-by-Step

29 views

5 days ago

Mohammad Alhaj (Techno Gate)
62. Python: Matplotlib Library Tutorial (5)

In this video, we explore Matplotlib, one of the most powerful and popular libraries in Python for creating data visualizations.

3:19
62. Python: Matplotlib Library Tutorial (5)

0 views

4 days ago

The Debug Zone
Matplotlib Make Center Circle Transparent

Today's Topic: Matplotlib Make Center Circle Transparent Thanks for taking the time to learn more. In this video I'll go through your ...

3:07
Matplotlib Make Center Circle Transparent

0 views

2 days ago

Jakubication
How To Install matplotlib in Python 3.14.3

This video shows how to install matplotlib on Python 3.14.3 It will walk you through, step-by-step, how to install matplotlib on ...

2:38
How To Install matplotlib in Python 3.14.3

0 views

13 hours ago

INFORMATION
Matplotlib Introduction,Line Plot and Count PlotPart  Matplotlib Bar Plot, Histogram and pie chart

code link https://colab.research.google.com/drive/19dSHtZNX4EAuwZ6fQbK2geTAH6LMZ1SB?usp=sharing.

38:29
Matplotlib Introduction,Line Plot and Count PlotPart Matplotlib Bar Plot, Histogram and pie chart

0 views

7 days ago

GIS Developer
Python Geospatial Visualization EXPLAINED | GeoPandas, Matplotlib & Plotly

In this tutorial, we explore how to visualize geospatial data in Python without using Folium — a common challenge for GIS ...

27:16
Python Geospatial Visualization EXPLAINED | GeoPandas, Matplotlib & Plotly

0 views

1 day ago