Upload date
All time
Last hour
Today
This week
This month
This year
Type
All
Video
Channel
Playlist
Movie
Duration
Short (< 4 minutes)
Medium (4-20 minutes)
Long (> 20 minutes)
Sort by
Relevance
Rating
View count
Features
HD
Subtitles/CC
Creative Commons
3D
Live
4K
360°
VR180
HDR
129,001 results
Check out my Full Tableau Course Here: https://www.analystbuilder.com/courses/tableau-for-data-visualization This is our first of ...
985,473 views
4 years ago
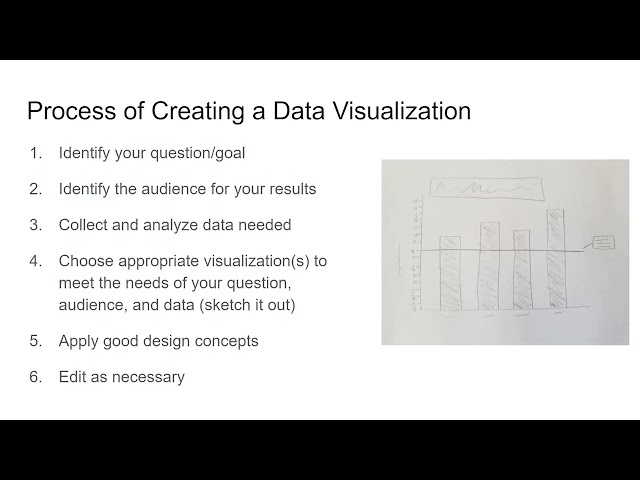
Presented by Angela Zoss. This video is part of a series of lectures recorded to teach about basic data visualization concepts.
102 views
In this video we take a look at the best resources to learn Data Visualization in 2025! 25% off Analyst Builder Code: ...
15,983 views
9 months ago
... Data Analysis Specialization - https://coursera.pxf.io/AoYOdR Tableau Data Visualization - https://coursera.pxf.io/MXYqaN ...
217,991 views
3 years ago
Introduction to network analysis and visualization with GEPHI. Datasets and tutorial here: ...
111,699 views
Presented by Tess Grynoch. This video is part of a series of lectures recorded to teach about basic data visualization concepts.
29 views
Presented by Alisa Rod. This video is part of a series of lectures recorded to teach about basic data visualization concepts.
326 views
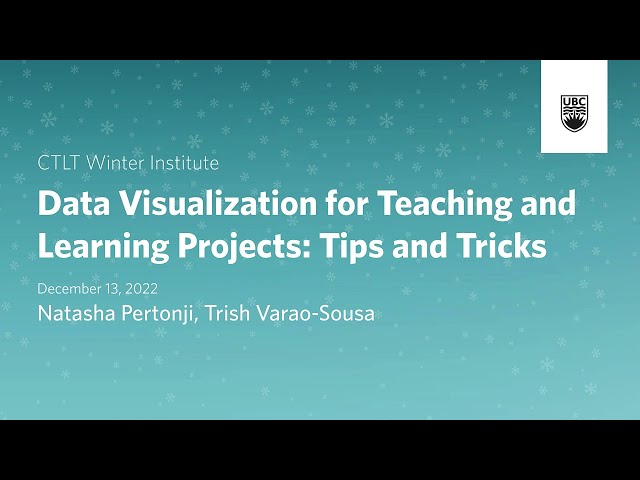
Dissemination is a critical part of teaching and learning projects. Choosing the best visualizations for sharing quantitative and ...
461 views
Welcome to our comprehensive tutorial on **Python PANDAS for Beginners**! In this video, we will dive into the powerful world of ...
103,473 views
1 year ago
In this video, we dive deep into the world of data visualization in Python using three powerful libraries: Matplotlib, Seaborn, and ...
3,654 views
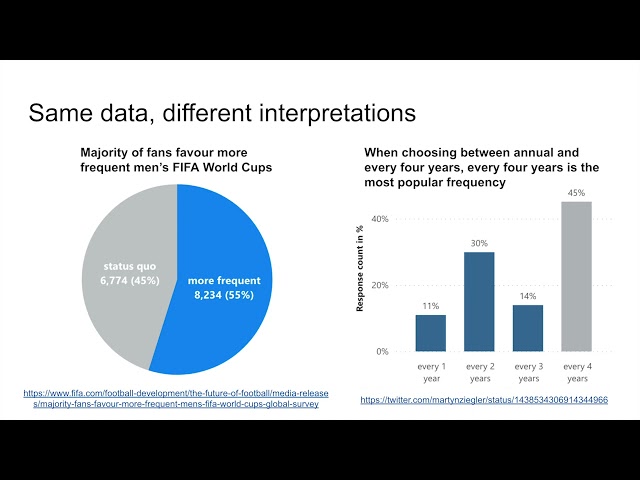
Whenever we see or generate a data visualization it's important that we review what does and doesn't work in the visual. In this ...
1,868 views
Presented by David Christensen. This video is part of a series of lectures recorded to teach about basic data visualization ...
316 views
116,886 views
2 years ago
This applied webinar explores best practices for communicating open educational data with a wide audience. Topics include ...
645 views
The data visualiser application allows the user to generate various charts directly within DHIS2. The Data Visualiser tool follows ...
10,204 views
7 years ago
This segment covers creating a new project, setting up your working directory, and installing/loading the required packages.
6,883 views
In this course you will learn how to visualize data with python matplotlib library. #Matplotlib is very powerful python library that can ...
6 views
... IBM Data Analysis Specialization - https://coursera.pxf.io/AoYOdR Tableau Data Visualization - https://coursera.pxf.io/MXYqaN ...
1,205,085 views
376,732 views
This tutorial will teach you hands-on practice on generating visualizations in Python with Matplotlib and also intuitively use. Data ...
47 views