ViewTube

ViewTube
Sign inSign upSubscriptions
Filters

Upload date

Type

Duration

Sort by

Features

Reset

164,775 results

BocoupLLC
Kai Chang - Visually Exploring Multidimensional Data

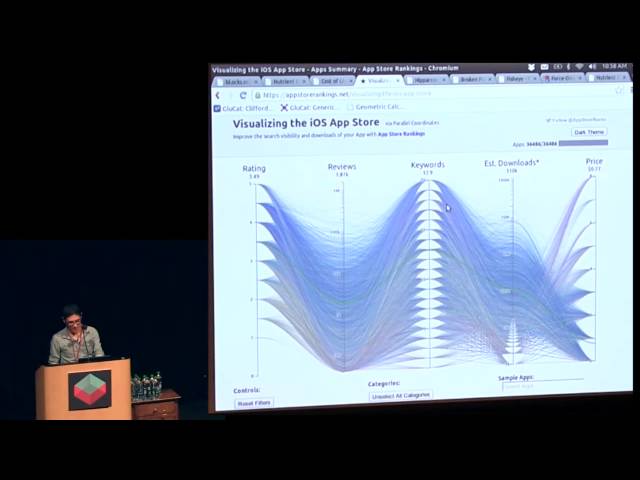
We will explore datasets like these by interacting with parallel coordinates: discovering relationships, identifying outliers, and ...

30:40
Kai Chang - Visually Exploring Multidimensional Data

25,968 views

12 years ago

BocoupLLC
Lisa Strausfeld & Christopher Cannon - Bloomberg Visual Data -  From Explanation to Exploration

I'm very excited to welcome our next team talk uh from the amazing bloomberg visual data team i'm so excited to have him here ...

45:44
Lisa Strausfeld & Christopher Cannon - Bloomberg Visual Data - From Explanation to Exploration

656 views

11 years ago

Chad Boeninger
How to use Passport's visual data dashboard  to understand international consumer markets

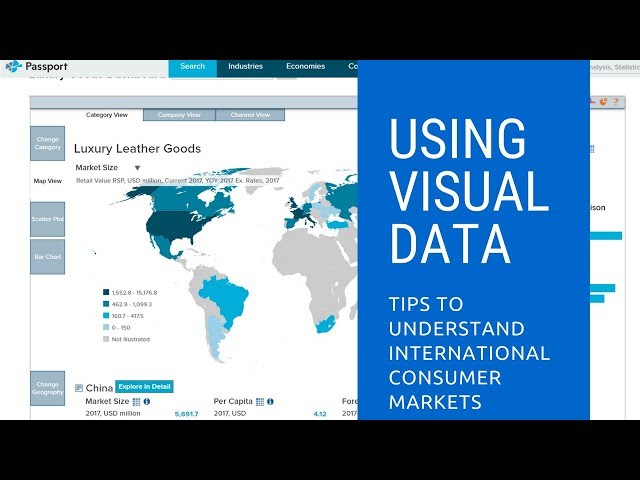
It's easy to get overwhelmed when researching international markets for consumer product categories. Euromonitor's Passport ...

2:36
How to use Passport's visual data dashboard to understand international consumer markets

420 views

7 years ago

Introduction to Data Science
Communication 3: The Visual Presentation of Data

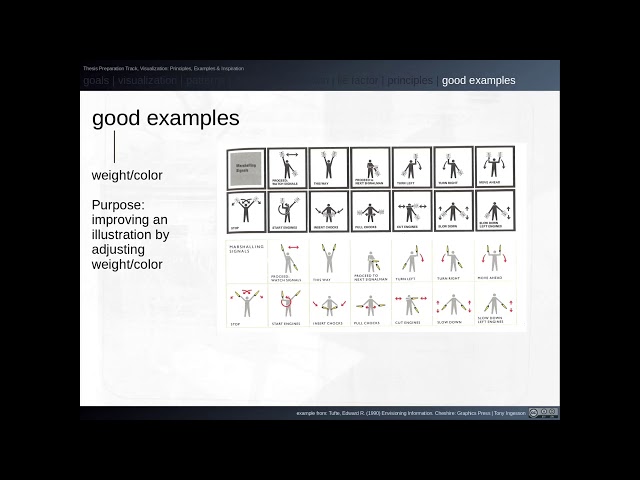
Some examples of best practices and some things to avoid when producing data visualisations.

3:57
Communication 3: The Visual Presentation of Data

202 views

3 years ago

Visualizing the Future
Visual Principles/Properties | Data Visualization 101

Presented by David Christensen. This video is part of a series of lectures recorded to teach about basic data visualization ...

5:18
Visual Principles/Properties | Data Visualization 101

157 views

4 years ago

BetaNYC
Low code visual data exploration with NYC public data

NYC Open Data Week 2022 - Mar 12 2022 Have you ever felt trapped by only having a few chart types to choose from in your ...

1:02:48
Low code visual data exploration with NYC public data

67 views

3 years ago

Alex The Analyst
Popular Visualizations in Power BI | Microsoft Power BI for Beginners

Take my Full Power BI Course Here: https://www.analystbuilder.com/courses/microsoft-power-bi-desktop-for-business-intelligence ...

14:14
Popular Visualizations in Power BI | Microsoft Power BI for Beginners

212,142 views

3 years ago

CMU Database Group
ApertureDB: Designing a Purpose-built System for Visual Data and Data Science (Vishakha Gupta)

CMU Database Group - Vaccination Database Tech Talks - Booster (2022) Speakers: Vishakha Gupta (ApertureDB) March 7, ...

56:38
ApertureDB: Designing a Purpose-built System for Visual Data and Data Science (Vishakha Gupta)

1,403 views

3 years ago

Tony Ingesson - Teaching & Research Videos
Visualization of data: basic visual design (pt. 1/2)

A two-part short lecture on visualization of data: basic visual design principles, bad examples and what Edward Tufte calls "the lie ...

16:06
Visualization of data: basic visual design (pt. 1/2)

345 views

5 years ago

Jonathan Dinu
Basics of Visual Encodings | Introduction to Data Visualization

Recordings from the University of San Francisco's Spring 2016 MSAN 622 course: Introduction to Data and Information ...

41:48
Basics of Visual Encodings | Introduction to Data Visualization

426 views

9 years ago

Microsoft Visual Studio
How to analyze massive amounts of data from Visual Studio with Data Lake Analytics

Azure Data Lake (ADL) makes it easy to get started with massive amounts of data. ADL builds on many years of experience that ...

9:28
How to analyze massive amounts of data from Visual Studio with Data Lake Analytics

4,793 views

10 years ago

Syracuse University iSchool
What is Visual Analytics? | Syracuse University iSchool | Data Science Day

Presented by Jeff Hemsley, Associate Professor & Director of the Center for Computational & Data Science (CCDS) at the ...

26:15
What is Visual Analytics? | Syracuse University iSchool | Data Science Day

2,907 views

4 years ago

Samuel Huron
Input Visualization: Collecting and Modifying Data with Visual Representations (Full talk Chi 2024)

We examine input visualizations, visual representations that are designed to collect (and represent) new data rather than encode ...

12:07
Input Visualization: Collecting and Modifying Data with Visual Representations (Full talk Chi 2024)

45 views

1 year ago

Alex Followell | AI Automation
How To Make Stunning Charts From a CSV in 60 Seconds! (n8n + Datawrapper)

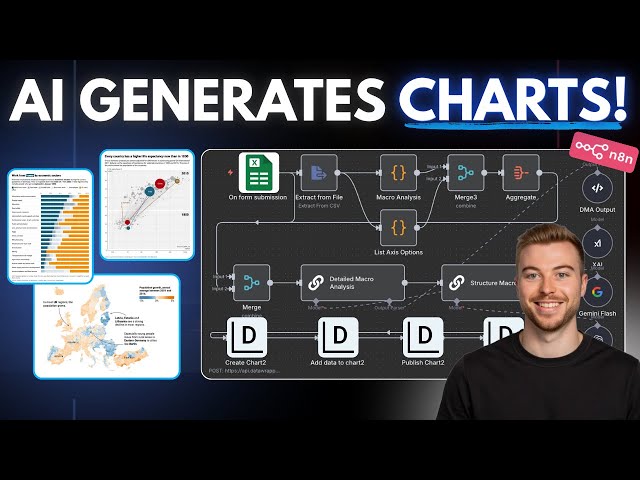
Access AI blueprints, tutorials, tools & expert help to level up fast! https://bit.ly/4lV67U2 Links Mentioned: - ⚡️ n8n: ...

26:27
How To Make Stunning Charts From a CSV in 60 Seconds! (n8n + Datawrapper)

2,147 views

6 months ago

PexBell
Data Analysis Free Stock Video - Data Analytics Stock Footage - Graphs Stock Footage - Data Videos

Thanks for Watching! Please Subscribe to Our Channel. Data Analysis Free Stock Video - Data Analytics Stock Footage - Graphs ...

2:38
Data Analysis Free Stock Video - Data Analytics Stock Footage - Graphs Stock Footage - Data Videos

36,762 views

3 years ago

Lars Juhl Jensen
Data visualization: A short introduction to the core concepts of data visualization on networks

A short introduction to the core concepts of data visualization and their application to network biology. The presentation provides a ...

6:55
Data visualization: A short introduction to the core concepts of data visualization on networks

4,549 views

4 years ago

NWeLearn
Data Visual Literacy

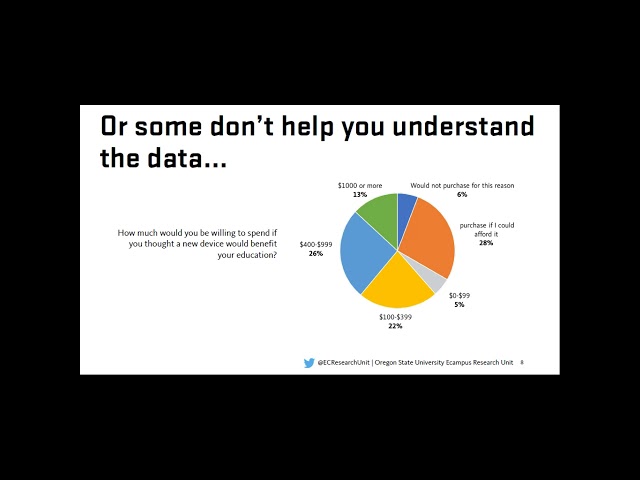
Presenters: Amy Donley & Dr. Mary Ellen Dello Stritto Date: Thursday, October 17 • 9:40am - 10:40am Data Visual Literacy: What ...

3:18:51
Data Visual Literacy

31 views

6 years ago

Tony Ingesson - Teaching & Research Videos
Visualization of data: basic visual design (pt. 2/2)

A two-part short lecture on visualization of data: basic visual design principles, bad examples and what Edward Tufte calls "the lie ...

12:14
Visualization of data: basic visual design (pt. 2/2)

224 views

5 years ago

Zen Vibes (Zen Ed Paradise)
Visual Data: What Happen If You Got Shot

We are sorry for the late upload,there are some connection problem yesterday that make us late to upload, please enjoy This ...

5:09
Visual Data: What Happen If You Got Shot

219 views

4 years ago

TALE: The Archaeology Lecture E-library
Landscapes of disappearance in São Paulo: data modelling and visual analytics

The Brazilian military dictatorship (1964-1985) used disappearance as one of its strategies, leaving hundreds of missing persons ...

15:00
Landscapes of disappearance in São Paulo: data modelling and visual analytics

30 views

5 years ago