ViewTube

ViewTube
Sign inSign upSubscriptions
Filters

Upload date

Type

Duration

Sort by

Features

Reset

44 results

Maven Analytics
Learn Python: Create Simple & Clear Data Visualizations with Matplotlib

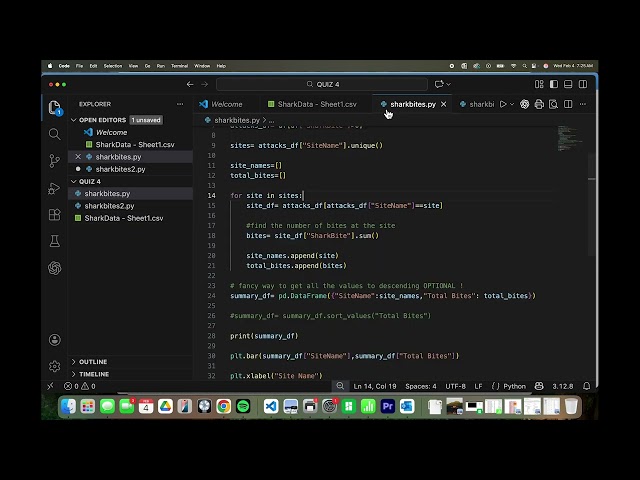
Visualizing data helps you understand it faster, and Matplotlib is one of the best Python tools for making charts. In this video, Lead ...

9:43
Learn Python: Create Simple & Clear Data Visualizations with Matplotlib

0 views

2 hours ago

Jakubication
How To Install matplotlib in Python 3.14.3

This video shows how to install matplotlib on Python 3.14.3 It will walk you through, step-by-step, how to install matplotlib on ...

2:38
How To Install matplotlib in Python 3.14.3

0 views

10 hours ago

TheKnowledgeBase
Matplotlib:subplots fonts overlap

tech,tech news,best tech,cheap tech,tech gifts,weird tech,tech fails,ces 2025 tech,ces tech,big tech,dog tech,new tech,top tech ...

1:04
Matplotlib:subplots fonts overlap

0 views

4 hours ago

Roel Van de Paar
Mapping a plus symbol with matplotlib (2 Solutions!!)

Mapping a plus symbol with matplotlib Helpful? Please use the *Thanks* button above! Or, thank me via Patreon: ...

3:29
Mapping a plus symbol with matplotlib (2 Solutions!!)

0 views

8 hours ago

dylan rainbolt ⚡
Filtering & Graphing Shark Bite Data (Prompt 2) using Pandas and Matplotlib in Python
9:39
Filtering & Graphing Shark Bite Data (Prompt 2) using Pandas and Matplotlib in Python

0 views

2 hours ago

Sujeet Kumar Advanced Excel Training in Hindi
Python Charts - Pandas Plot and Matplotlib

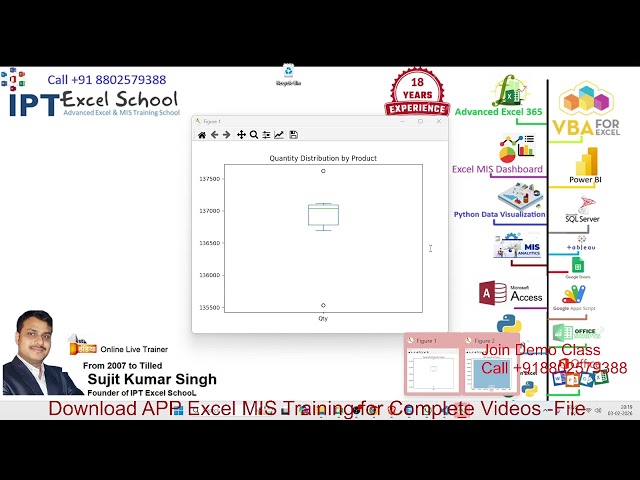
Download Excel VBA MIS Learning - App - https://play.google.com/store/apps/details?id=co.hodor.jqijz iOS ...

30:15
Python Charts - Pandas Plot and Matplotlib

18 views

14 hours ago

ToodMind
Waxaan Sameeyay Dastuur Agent

Welcome to Omar Tood Unlock the world of Data Science, Machine Learning, and Artificial Intelligence. On this channel, you'll ...

9:14
Waxaan Sameeyay Dastuur Agent

0 views

5 hours ago

Data Science & KI mit Fabio
Python in Excel: Plots mit Matplotlib und Seaborn

Community: https://www.skool.com/data-science-mit-fabio-8200 Timestamps: 00:00 Einführung 00:10 Was ist Matplotlib? 00:23 ...

7:32
Python in Excel: Plots mit Matplotlib und Seaborn

9 views

8 hours ago

Simplilearn
Data Analytics With Python 2026 | Python Data Analytics Tutorial for Beginners | Simplilearn

Applied Generative AI Specialization, delivered by Simplilearn in collaboration with Purdue University ...

1:56:55
Data Analytics With Python 2026 | Python Data Analytics Tutorial for Beginners | Simplilearn

46 views

55 minutes ago

Simplilearn
Python for Data Science Full Course 2026 [Free] | Learn Data Science With Python | Simplilearn

Applied Generative AI Specialization, delivered by Simplilearn in collaboration with Purdue University ...

11:55:00
Python for Data Science Full Course 2026 [Free] | Learn Data Science With Python | Simplilearn

2,698 views

Streamed 1 day ago

Mobilo
Matplotlib - Introduction to Google Colab

Python reigns supreme in data analysis. However, data placed in a table can't speak for itself. Learn to add plots to your ...

4:12
Matplotlib - Introduction to Google Colab

0 views

8 hours ago

散戶程式交易教室 | MT5 | Python【 廣東話 / 國語 】
【國語】【Python常用Module】12. Matplotlib Module

Python | #IBKR | #Interactive Brokers | #盈透證券 | #TWS | #IBGateway | #ib_async | #美股 | #股票 | #程式交易 #Program Trading ...

9:51
【國語】【Python常用Module】12. Matplotlib Module

1 view

5 hours ago

SummarizedAI
Pandas Explained: From Raw Data to Insights #pandas #python #pythonpandas #pandastutorial #ai

Welcome back to Summarized AI ! If you're working with data in Python—whether it comes from CSV files, Excel sheets, ...

7:00
Pandas Explained: From Raw Data to Insights #pandas #python #pythonpandas #pandastutorial #ai

0 views

23 hours ago

ACTE Technologies - Siruseri Branch, Chennai
Libraries in Python for Data Science  Complete Beginner Friendly Guide

Python becomes powerful because of its libraries. In this video, you'll learn the most important Python libraries used in Data ...

49:25
Libraries in Python for Data Science Complete Beginner Friendly Guide

0 views

4 hours ago

Root Access
Matplotlib Complete Course | Create Stunning Visualizations in Python

Master Data Visualization with Python's Most Powerful Library! Perfect for students, beginners, and aspiring data scientists.

1:01:08
Matplotlib Complete Course | Create Stunning Visualizations in Python

17 views

7 hours ago

Vet AI
PaperBanana: The Google Agentic AI That Creates Your Scientific Diagrams 🍌🎨

Tired of wasting hours designing diagrams for your papers or technical articles? In this video, we break down PaperBanana, ...

5:00
PaperBanana: The Google Agentic AI That Creates Your Scientific Diagrams 🍌🎨

42 views

17 hours ago

Dive in Data
SQL - ORDER VALUE CATEGORIZATION | LOW, MEDIUM, HIGH | TOP 75 SQL CODING INTERVIEW QUESTIONS

Download the E-Commerce database used in this video here: ...

7:41
SQL - ORDER VALUE CATEGORIZATION | LOW, MEDIUM, HIGH | TOP 75 SQL CODING INTERVIEW QUESTIONS

5 views

3 hours ago

Swavalamban Avam Swabhimaan Foundation
Python & Data Analytics Internship | Session 35: Linear Regression Analysis | SASF

Welcome to the official Python & Data Analytics Internship by SAS Foundation — an NGO empowering youth through education ...

1:00:19
Python & Data Analytics Internship | Session 35: Linear Regression Analysis | SASF

0 views

1 hour ago

Swavalamban Avam Swabhimaan Foundation
Python & Data Analytics Internship | Session 36: Classification with Logistic Regression | SASF

Welcome to the official Python & Data Analytics Internship by SAS Foundation — an NGO empowering youth through education ...

49:38
Python & Data Analytics Internship | Session 36: Classification with Logistic Regression | SASF

0 views

1 hour ago

PythonGuides
Increment and Decrement Operator in Python

In this video, we explain the increment and decrement concepts in Python, a topic that often confuses beginners. You'll learn ...

6:53
Increment and Decrement Operator in Python

0 views

4 hours ago