Upload date
All time
Last hour
Today
This week
This month
This year
Type
All
Video
Channel
Playlist
Movie
Duration
Short (< 4 minutes)
Medium (4-20 minutes)
Long (> 20 minutes)
Sort by
Relevance
Rating
View count
Features
HD
Subtitles/CC
Creative Commons
3D
Live
4K
360°
VR180
HDR
11 results
... Skills Covered ✓ Data Analytics ✓ Statistical Analysis using Excel ✓ Data Analysis using Python and R ✓ Data Visualization ...
2 views
2 minutes ago
इस चैनल पर आपको Microsoft Excel के आसान और practical tutorials मिलेंगे, जो beginners से लेकर ...
0 views
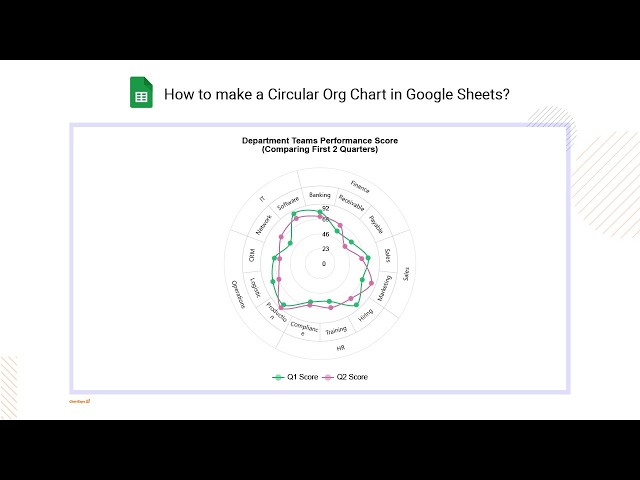
Learn how to make a Circular Org Chart in Google Sheets to clearly visualize organizational structure and team hierarchy.
59 minutes ago
... #ExcelVBA #VBATutorial #MacroExcel #PythonForExcel #PythonProgramming #PowerBI #DataVisualization #ExcelTraining ...
28 minutes ago
INSERTION SORT | Class 11 & 12 | ISC | Boards 2026 | JAVA | C++ | PYTHON | DATA STRUCTURE | #java #youtube #isc ...
7 views
23 minutes ago
Revizto #BIM #VDC #BIMCoordination #Revit #Navisworks #ConstructionTech #AEC #BIMWorkflow #Shorts ...
Data Visualization – Using Matplotlib, Seaborn, and Plotly to create impactful charts and dashboards. Power BI & Tableau ...
1 hour ago
In this video, you will learn how to plot graphs in Python using the Matplotlib library. Matplotlib is one of the most powerful and ...
In this video, we explore the different types of plot graphs used in data visualization. Plot graphs help represent data in a visual ...
17 minutes ago
... we show you exactly how to change chart type in cTrader to enhance your technical analysis and market data visualization.
4 minutes ago
How to Change Thinkorswim Background Color In this video, we show you exactly how to change Thinkorswim background color ...
38 minutes ago


![How to Change Chart Type in cTrader [2026 Full Guide]](/api/proxy/image?url=https%3A%2F%2Fi.ytimg.com%2Fvi%2FoFc-uC9Eg9Q%2Fsddefault.jpg)
![How to Change Thinkorswim Background Color [2026 Full Guide]](/api/proxy/image?url=https%3A%2F%2Fi.ytimg.com%2Fvi%2F454h7Yb2Sl0%2Fsddefault.jpg)