ViewTube

ViewTube
Sign inSign upSubscriptions
Filters

Upload date

Type

Duration

Sort by

Features

Reset

35,260 results

Chandoo
The Ultimate Excel Dashboard: Visualize Data Like a Pro

OFF My Dashboards Course (code: SAVE50) https://chandoo.org/wp/excel-school-program/ ~ Become an Excel Dashboard ...

29:50
The Ultimate Excel Dashboard: Visualize Data Like a Pro

81,570 views

3 months ago

Excel Campus - Jon
Google's New AI Creates Dashboards at INSANE Speeds

Save 75% on our AI Literacy for Excel Course during Black Friday/Cyber Monday ...

9:22
Google's New AI Creates Dashboards at INSANE Speeds

86,636 views

2 months ago

Leila Gharani
Python in Excel: The Smarter Way to Use External Data

New course: Learn Python in Excel — already 2500+ enrolled. Solve real data problems, right inside Excel ...

10:42
Python in Excel: The Smarter Way to Use External Data

168,344 views

9 months ago

Simon Sez IT
How to Create Data Visualization in Excel using Tables, Slicers and Charts (Includes Free Files)

Download the free course files and follow along here: ...

46:13
How to Create Data Visualization in Excel using Tables, Slicers and Charts (Includes Free Files)

2,839 views

3 months ago

Manus AI
Introducing Data Visualization for Manus

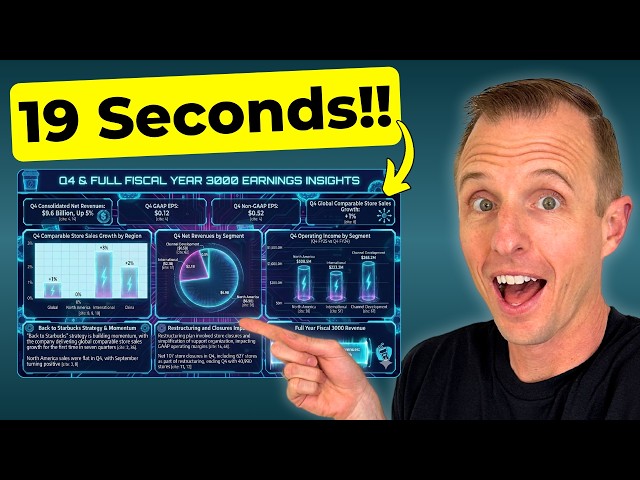
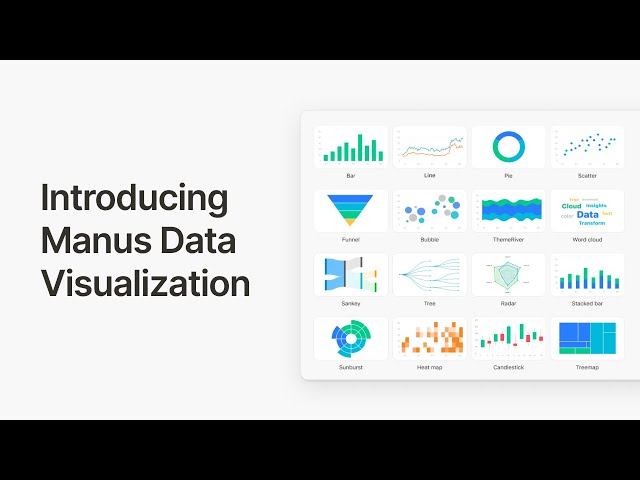
Introducing Data Visualization for Manus! Say goodbye to spreadsheet chaos. Whether you're analyzing competitors, prepping for ...

0:42
Introducing Data Visualization for Manus

17,161 views

7 months ago

Excel Bootcamp
ChartEngine Add-in for Excel - Data Visualization Tools

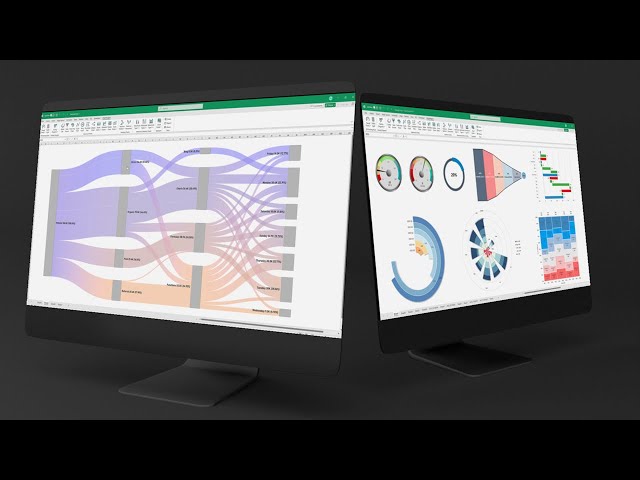
ChartEngine is an Excel Chart Add-in that provides stunning data visualizations. Learn more: https://chartengine.io/ A picture tells ...

1:11
ChartEngine Add-in for Excel - Data Visualization Tools

2,220 views

11 months ago

VBAMacrosAndMore
Visualize Data with Treemap Charts in Excel

Visualize Data with Treemap Charts in Excel Lots more videos here / @vbamacrosandmore4390 How to Create and Use ...

2:37
Visualize Data with Treemap Charts in Excel

83 views

8 months ago

ViSIT
Excel & SQL Server Integration: Effortless Data Analysis, Visualization and Reporting

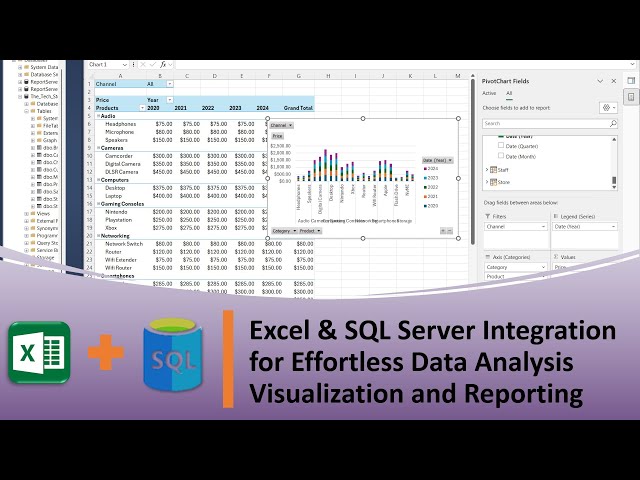
Tired of wrestling with complex SQL queries just to analyze your data? Welcome to this comprehensive tutorial where we'll unlock ...

18:57
Excel & SQL Server Integration: Effortless Data Analysis, Visualization and Reporting

548 views

9 months ago

Kenji Explains
Is Copilot in Excel Actually Useful? My Honest Thoughts

How I actually use Copilot in Excel and other Microsoft applications. Get the FREE ChatGPT & Excel Workflow Guide from ...

13:28
Is Copilot in Excel Actually Useful? My Honest Thoughts

34,331 views

8 months ago

Kenji Explains
Create Dashboards in Seconds With AI (It's Mind-Blowing 🤩)

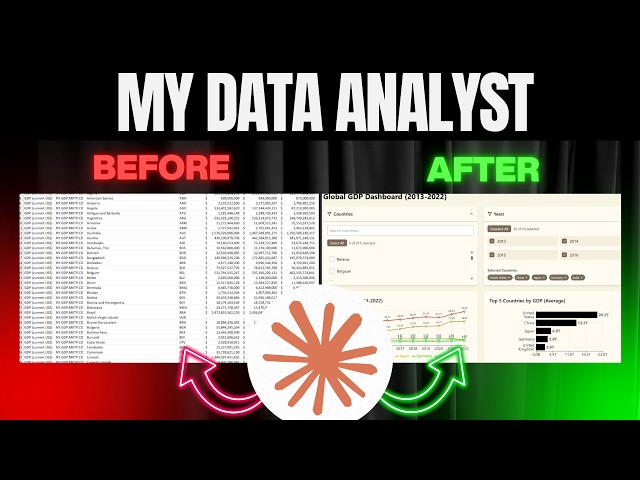
... DOWNLOAD Free Excel file for this video: https://careerprinciples.myflodesk.com/cjuvk76zax In this video, we go over 4 different ...

9:59
Create Dashboards in Seconds With AI (It's Mind-Blowing 🤩)

158,021 views

9 months ago

Ms Excel
Create Professional Excel Dashboard in just 10 Minutes || Interactive & Dynamic #excel #dashboard

We're bringing you the best Excel tips and tricks to help you become a spreadsheet expert! Don't forget to hit that like button to ...

13:40
Create Professional Excel Dashboard in just 10 Minutes || Interactive & Dynamic #excel #dashboard

363,327 views

5 months ago

Andreas Exadaktylos
How to Build a Habit Tracker Dashboard in Excel (With Checkboxes & Charts!)

Download the COMPLETE workbook: https://bit.ly/43lJu36 Excel Dashboard Course ▶️ https://bit.ly/mellondash Learn how to ...

32:48
How to Build a Habit Tracker Dashboard in Excel (With Checkboxes & Charts!)

28,455 views

9 months ago

Rahim Zulfiqar Ali
Create Dashboard / Visuals in Just Few Clicks with Copilot in Excel 365 - Artificial Intelligence

Create Dashboard / Visuals in Just Few Clicks with CoPilot in Excel 365 - Artificial Intelligence #AI #CoPilot #Excel.

3:27
Create Dashboard / Visuals in Just Few Clicks with Copilot in Excel 365 - Artificial Intelligence

8,032 views

10 months ago

Sodit Tech Academy
🚦 Data Visualization in Excel | Create Stunning Dashboards & Charts🚦

Unlock the power of data visualization in Microsoft Excel with this step-by-step tutorial! In this project, I'll walk you through ...

1:25
🚦 Data Visualization in Excel | Create Stunning Dashboards & Charts🚦

36 views

6 months ago

Learn Skills Daily
Excel Visualize Your Data Tutorial

Excel Visualize Your Data Tutorial Get Ad-Free Training by becoming a member today!

50:21
Excel Visualize Your Data Tutorial

14,544 views

11 months ago

Kenji Explains
Best AI Tools Every Data Analyst Should Know in 2026

Get the FREE ChatGPT & Excel Workflow Guide from Hubspot: https://clickhubspot.com/40778a DOWNLOAD Free Excel file ...

13:27
Best AI Tools Every Data Analyst Should Know in 2026

76,492 views

6 months ago

Reza Dorrani
How to Turn Excel Spreadsheets into Power Apps (2025) | Step-by-Step Beginners Tutorial

In this 2025 Power Apps tutorial, learn how to transform your Excel spreadsheets into fully functional Power Apps — from setup to ...

22:46
How to Turn Excel Spreadsheets into Power Apps (2025) | Step-by-Step Beginners Tutorial

148,427 views

3 months ago

Office Tech Skill
Claude Built This Dashboard in Seconds with 1 Prompt | Data Analytics

... data analytics,power query,power pivot,excel dashboards,data transformation excel,excel data modeling,data visualization ...

3:26
Claude Built This Dashboard in Seconds with 1 Prompt | Data Analytics

997 views

9 months ago

Gurru Tech Solutions
Nano Banana + Gemini 3: AI Data Visualization That Actually Works

Nano Banana + Gemini 3: The Data Visualization Workflow You Need | Stop Making Boring Charts – Use This Nano Banana + ...

10:14
Nano Banana + Gemini 3: AI Data Visualization That Actually Works

24,489 views

2 months ago

Lanret Academy
DATA VISUALIZATION IN MS EXCEL

DATA VISUALIZATION IN MS EXCEL.

9:53
DATA VISUALIZATION IN MS EXCEL

18 views

8 months ago