Upload date
All time
Last hour
Today
This week
This month
This year
Type
All
Video
Channel
Playlist
Movie
Duration
Short (< 4 minutes)
Medium (4-20 minutes)
Long (> 20 minutes)
Sort by
Relevance
Rating
View count
Features
HD
Subtitles/CC
Creative Commons
3D
Live
4K
360°
VR180
HDR
21,942 results
To learn for free on Brilliant, go to https://brilliant.org/techwithtim . Brilliant's also given our viewers 20% off an annual Premium ...
6,698 views
8 days ago
Our favourite plotting library may just be matplotlib again now that we made it interactive with a puck! It may sounds strange at first, ...
6,128 views
4 days ago
python #coding #matplotlib This video serves as an introduction to the Matplotlib Python library. We'll cover the basics of ...
76,845 views
3 months ago
Register for Intellipaat's Premium Data Science Course: https://intellipaat.com/data-scientist-course-training/ Access the ...
90,503 views
7 months ago
python #coding #matplotlib Matplotlib is a Python library used for data visualization. It provides a MATLAB-like interface for quick ...
23,890 views
4 months ago
Master AI from Zero to Advanced: https://ailearninghub.io ------------------------- In this video, you'll learn the fundamentals of creating ...
810 views
9 months ago
How to Set Axis Limits in Matplotlib | Python Plotting Tutorial In this tutorial, you'll learn how to set custom axis limits using Python ...
31 views
6 months ago
If you appreciate the content and the hard work, Please subscribe - https://www.youtube.com/@KeertiPurswani ...
21,338 views
11 months ago
Create a Square Pattern Plot Using Python Matplotlib In this video, you will learn how to create a square pattern plot using ...
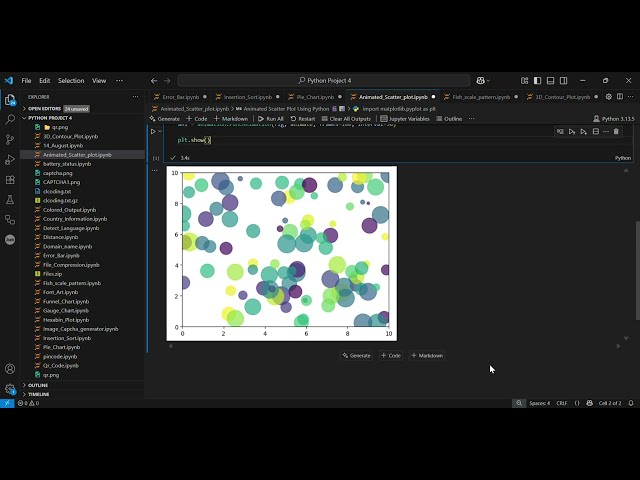
42 views
1 month ago
Create Amazing Animated Scatter Plots in Python | Matplotlib Animation Tutorial Bring your data to life! In this Python tutorial, I'll ...
71 views
5 months ago
In this beginner-friendly tutorial, we walk through how to create line charts, scatter plots, and box plots using the powerful ...
1,278 views
Matplotlib Python Tutorial for Beginners | Data Visualization in Python Matplotlib is a python library used for data ...
4,707 views
Master Data Visualization with Python in Just 30 Minutes! In this crash course, you'll learn the fundamentals of Matplotlib and ...
176 views
10 months ago
Learn how to create stunning scatter plots using Matplotlib in Python! In this tutorial, we'll walk you through the basics of scatter ...
245 views
Learn How to Create Scatter Plot and Basic Visualizations in Python using Matplotlib & Seaborn!** In this beginner-friendly tutorial ...
52 views
Welcome to Part 1 of our series on Customizing Plots using Matplotlib in Python! In this tutorial, we'll dive into the art of ...
34 views
Masters In Data-Analytics with GenAI with Job Guarantee Program - https://codingwise.in/program/data-analytics Python for Data ...
211,157 views
Learn how to create your first simple line graph in Python using the Matplotlib library! This short tutorial helps beginners visualize ...
74 views
How to Create Stunning 3D Graphs in Python | Matplotlib Tutorial Learn how to create professional 3D surface plots in Python ...
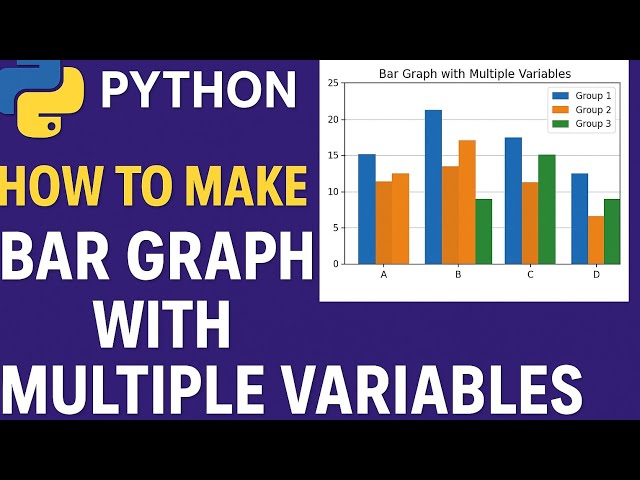
How to Make Bar Graph with Multiple Variables in Python (Step-by-Step Tutorial)** Learn how to create **bar graphs with multiple ...
54 views