Upload date
All time
Last hour
Today
This week
This month
This year
Type
All
Video
Channel
Playlist
Movie
Duration
Short (< 4 minutes)
Medium (4-20 minutes)
Long (> 20 minutes)
Sort by
Relevance
Rating
View count
Features
HD
Subtitles/CC
Creative Commons
3D
Live
4K
360°
VR180
HDR
348 results
DBSCAN Clustering in Python | Machine Learning Tutorial For Beginners | Day 25 #machinelearning #DBSCAN Clustering ...
10 views
7 days ago
#MachineLearning #Mathematics #ArtificialIntelligence #LinearAlgebra #Calculus #DeepLearning #DataScience #Tutorial #KNN ...
229 views
5 days ago
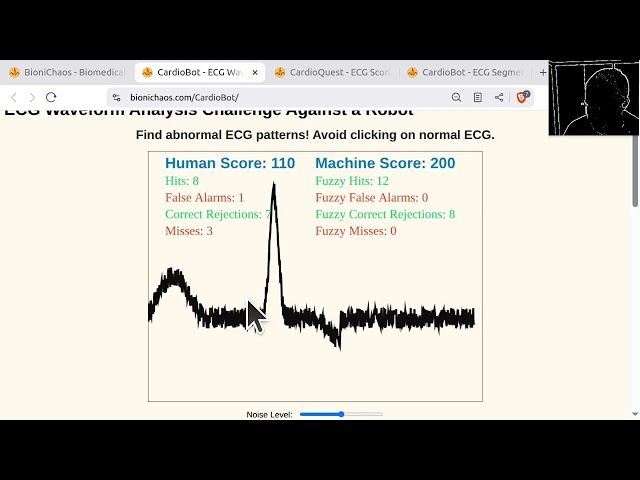
Master ECG segmentation and biomedical data visualization with the interactive tools at BioniChaos. In this video, we explore the ...
0 views
2 days ago
BioniChaos: Building a Prosthetic Arm Simulation with Vanilla JS and AI Data Science Are you interested in the intersection of ...
3 days ago
In this video you will learn how to turn simple CSV data into a professional 3D bar chart using Blender and Python. We walk ...
19 views
Streamed 1 day ago
Join My Skool Community (FULL Templates & more) - https://www.skool.com/ai-automations-for-sales Sign up to Perplexity ...
558 views
The 21st OpenAIRE Graph Community Call took place on Wednesday 21 January 2026, and was a hands-on exploration to learn ...
15 views
6 days ago
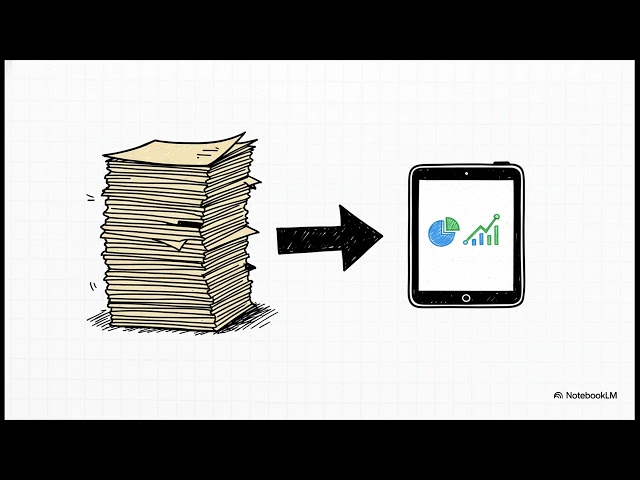
Small and medium-sized businesses don't need a data science team to forecast profit, cash flow, or inventory needs.
7 views
#Probability #RandomVariable #CS1 #Statistics #ActuarialScience #DAtaScience #ProbabilityDistribution #PMF #PDF #CDF ...
28 views
Streamed 7 days ago
This session introduces how Pandas and SQL work together inside Azure Databricks for data analysis and data preparation.
1 day ago
A Python based workbench for early phase data engineering on the OSDU Data Platform Camilo Angarita - Aker BP.
72 views
20 views
My Microsoft Excel Playlist: https://www.youtube.com/playlist?list=PLHrw3fxxgFBRyH308kfvRZnAIevkaKkf0 Are you using 3-D ...
10,935 views
You can find the lecture notes and exercises for this lecture at https://missing.csail.mit.edu/2026/debugging-profiling/ 0:00:00 ...
2,875 views
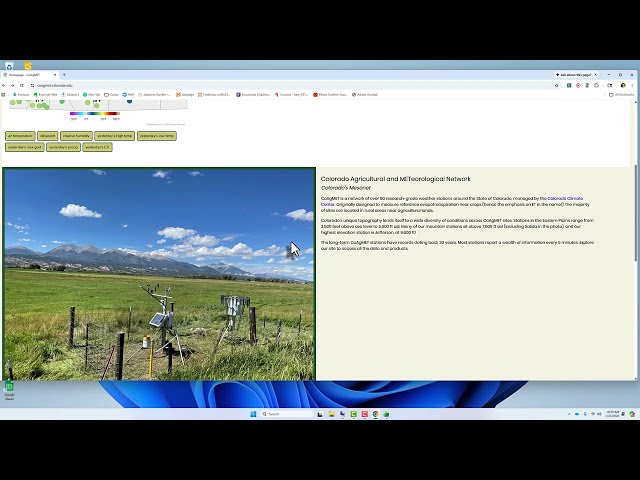
Importing Daily Weather Data from CoAgMet to Excel, and plotting data.
31 views
This is a similation incorporating studying the relationship between pressure and amount in terms of "PUFFS". Question: Linear or ...
The Future of AI in Education: Personalized Learning Redefined Discover how Artificial Intelligence is transforming the ...
48 views
4 days ago
In this video, I'll show you how to build a custom Direct Line client to chat with your Microsoft Copilot Studio agents through Azure ...
56 views
Pat creates two plots in this livestream. First, he recreates a horizontal of panels that were presented as facets in the original figure ...
422 views


![Azure Databricks | Introduction to Pandas with SQL | Data Engineering Tutorial by @igmGuru [2026]](/api/proxy/image?url=https%3A%2F%2Fi.ytimg.com%2Fvi%2Fj_xw8dTaTkM%2Fsddefault.jpg)