ViewTube

ViewTube
Sign inSign upSubscriptions
Filters

Upload date

Type

Duration

Sort by

Features

Reset

442 results

Dr. Turtl
Matplotlib Workflow to Make Professional Figures 5X Faster

Making high-quality data visualizations can take hours - but it doesn't have to. We'll walk through a clean, efficient workflow for ...

11:30
Matplotlib Workflow to Make Professional Figures 5X Faster

187 views

3 months ago

The Debug Zone
How to Fill a Matplotlib Polygon with a Gradient Between Vertices

In this video, we'll explore the fascinating world of data visualization using Matplotlib, focusing specifically on how to fill a polygon ...

1:42
How to Fill a Matplotlib Polygon with a Gradient Between Vertices

3 views

10 months ago

Nida Karagoz
No module named 'matplotlib.backends.registry' (4 SOLUTIONS!!)

No module named 'matplotlib.backends.registry' (4 SOLUTIONS!!) ✧ I really hope you found a helpful solution! ♡ The Content is ...

4:22
No module named 'matplotlib.backends.registry' (4 SOLUTIONS!!)

80 views

11 months ago

The Debug Zone
How to Use imshow to Print a Single Color in Python Matplotlib

In this video, we'll explore how to use the `imshow` function in Python's Matplotlib library to display a single color image. Whether ...

1:32
How to Use imshow to Print a Single Color in Python Matplotlib

4 views

10 months ago

The Debug Zone
How to Add a Legend in Matplotlib Based on Existing Color Series

In this video, we'll explore the process of adding a legend to your Matplotlib visualizations, specifically focusing on how to ...

1:29
How to Add a Legend in Matplotlib Based on Existing Color Series

9 views

9 months ago

The Debug Zone
Creating Custom Legends with Hatching in Matplotlib: A Step-by-Step Guide

In this video, we dive into the world of data visualization using Matplotlib, focusing on the powerful technique of creating custom ...

1:31
Creating Custom Legends with Hatching in Matplotlib: A Step-by-Step Guide

3 views

6 months ago

The Debug Zone
How to Clear Memory in Python Matplotlib: Tips for Efficient Plotting

In this video, we dive into the essential techniques for managing memory when using Matplotlib in Python. As data visualization ...

2:42
How to Clear Memory in Python Matplotlib: Tips for Efficient Plotting

5 views

7 months ago

The Debug Zone
How to Match Subplot Sizes in Matplotlib: Using imshow and scatter

In this video, we'll explore the essential techniques for matching subplot sizes in Matplotlib, focusing on the powerful functions ...

2:36
How to Match Subplot Sizes in Matplotlib: Using imshow and scatter

3 views

8 months ago

The Debug Zone
How to Create Classic Stock Charts with Matplotlib: A Step-by-Step Guide

In this video, we'll dive into the world of data visualization using Matplotlib, one of the most powerful libraries in Python. Whether ...

5:08
How to Create Classic Stock Charts with Matplotlib: A Step-by-Step Guide

1 view

7 months ago

Peter Schneider
How can I have a matplotlib legend span the plot areas of the subplots?

How can I have a matplotlib legend span the plot areas of the subplots? I hope you found a solution that worked for you :) The ...

4:39
How can I have a matplotlib legend span the plot areas of the subplots?

0 views

4 months ago

The Debug Zone
How to Draw a Zoom Effect Line on Subplots in Matplotlib

In this video, we'll explore the fascinating world of data visualization using Matplotlib, focusing specifically on how to create a ...

3:12
How to Draw a Zoom Effect Line on Subplots in Matplotlib

11 views

8 months ago

The Debug Zone
Matplotlib Subplots with Dual Y Axes: A Step-by-Step Guide

In this video, we'll explore the powerful capabilities of Matplotlib for creating subplots with dual Y axes. Whether you're visualizing ...

1:53
Matplotlib Subplots with Dual Y Axes: A Step-by-Step Guide

2 views

7 months ago

The Debug Zone
Fixing Matplotlib Errors in Multiprocessing: Common Issues and Solutions

In this video, we dive into the common pitfalls and errors encountered when using Matplotlib in a multiprocessing environment.

1:43
Fixing Matplotlib Errors in Multiprocessing: Common Issues and Solutions

8 views

8 months ago

The Debug Zone
Fixing Matplotlib Animation Not Showing: Common Issues and Solutions

In this video, we dive into the common challenges faced when working with Matplotlib animations in Python. If you've ever ...

2:32
Fixing Matplotlib Animation Not Showing: Common Issues and Solutions

30 views

9 months ago

The Debug Zone
How to Graph k-NN Decision Boundaries Using Matplotlib: A Step-by-Step Guide

In this video, we will explore the fascinating world of k-Nearest Neighbors (k-NN) and how to visualize its decision boundaries ...

1:31
How to Graph k-NN Decision Boundaries Using Matplotlib: A Step-by-Step Guide

4 views

5 months ago

Peter Schneider
Hollowing out a patch / "anticlipping" a patch in Matplotlib (Python)

Hollowing out a patch / "anticlipping" a patch in Matplotlib (Python) I hope you found a solution that worked for you :) The Content ...

3:44
Hollowing out a patch / "anticlipping" a patch in Matplotlib (Python)

8 views

10 months ago

The Debug Zone
How to Add Sub-Axes in Matplotlib with Cartopy: Positioning and Sizing Tips

In this video, we delve into the powerful combination of Matplotlib and Cartopy to enhance your data visualizations. Learn how to ...

1:36
How to Add Sub-Axes in Matplotlib with Cartopy: Positioning and Sizing Tips

0 views

2 months ago

The Debug Zone
Mastering Dynamic Plotting with Matplotlib Animation: Tips and Solutions

In this video, we dive into the exciting world of dynamic plotting using Matplotlib's animation capabilities. Whether you're a data ...

2:37
Mastering Dynamic Plotting with Matplotlib Animation: Tips and Solutions

3 views

6 months ago

The Debug Zone
How to Set Explicit Width and Height of Axes in Matplotlib: A Step-by-Step Guide

In this video, we'll dive into the world of Matplotlib, one of the most popular plotting libraries in Python. Setting explicit width and ...

2:32
How to Set Explicit Width and Height of Axes in Matplotlib: A Step-by-Step Guide

3 views

6 months ago

The Debug Zone
How to Add Percentage Labels to a Stacked Barplot in Python/Matplotlib

In this video, we'll explore how to enhance your data visualizations by adding percentage labels to stacked barplots using ...

1:51
How to Add Percentage Labels to a Stacked Barplot in Python/Matplotlib

10 views

8 months ago

The Debug Zone
Understanding Matplotlib: Subplots vs Axes vs Axis Explained

In this video, we dive into the essential components of Matplotlib, one of the most popular plotting libraries in Python. We'll clarify ...

1:54
Understanding Matplotlib: Subplots vs Axes vs Axis Explained

9 views

5 months ago

The Debug Zone
How to Fix Small Matplotlib Figures in Jupyter Notebook Until Cell Completes

In this video, we'll explore a common challenge faced by data scientists and analysts using Jupyter Notebook: dealing with small ...

1:32
How to Fix Small Matplotlib Figures in Jupyter Notebook Until Cell Completes

2 views

3 months ago

The Debug Zone
How to Remove Extra Plots in Matplotlib Subplots: A Step-by-Step Guide

In this video, we'll explore a common challenge faced by data visualizers using Matplotlib: how to effectively remove extra plots ...

1:44
How to Remove Extra Plots in Matplotlib Subplots: A Step-by-Step Guide

2 views

6 months ago

Roel Van de Paar
How to have matplotlib's imshow generate an image without being plotted?

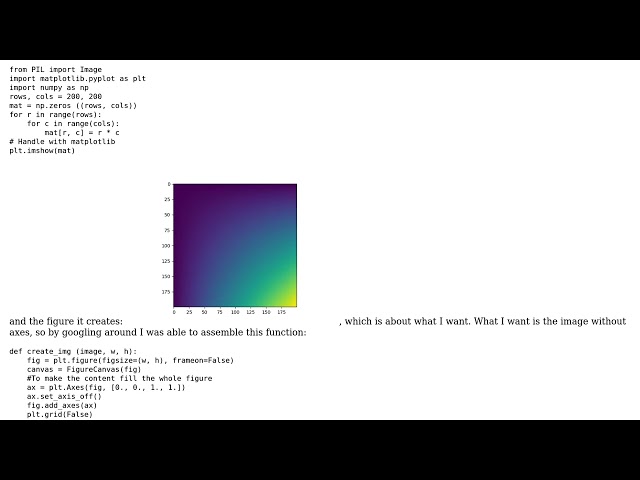
How to have matplotlib's imshow generate an image without being plotted? Helpful? Please use the *Thanks* button above!

2:27
How to have matplotlib's imshow generate an image without being plotted?

10 views

4 months ago

Single-line
No module named 'matplotlib.backends.registry'

Source: https://stackoverflow.com/questions/79301193 Question Author: - Malihe Mahdavi sefat ...

2:01
No module named 'matplotlib.backends.registry'

13 views

1 month ago