Upload date
All time
Last hour
Today
This week
This month
This year
Type
All
Video
Channel
Playlist
Movie
Duration
Short (< 4 minutes)
Medium (4-20 minutes)
Long (> 20 minutes)
Sort by
Relevance
Rating
View count
Features
HD
Subtitles/CC
Creative Commons
3D
Live
4K
360°
VR180
HDR
43,407 results
Take my Full Excel for Data Analytics Course! https://www.analystbuilder.com/courses/excel-for-data-analytics In this video we ...
1,174,445 views
3 years ago
Simple techniques - using Excel and other tools - can help you to visualize data and present information clearly and effectively.
42 views
9 years ago
In this Microsoft Excel tutorial, you'll learn how to make great data visualizations in Excel. Learn and master the art of creating a ...
399 views
Take my Full Excel Course Here: https://www.analystbuilder.com/courses/excel-for-data-analytics Download Datasets: ...
126,291 views
1 year ago
Learn how to master Excel skills by learning both basic and extended data visualization and business intelligence related ...
124 views
Take my Full Excel for Data Analytics Course! https://www.analystbuilder.com/courses/excel-for-data-analytics Excel is one of the ...
781,998 views
In Ms excel you can Interactive Dashboard in Ms Excel | Data Visualization in Ms Excel | Create Dashboard in Excel Ease, we ...
127 views
4 years ago
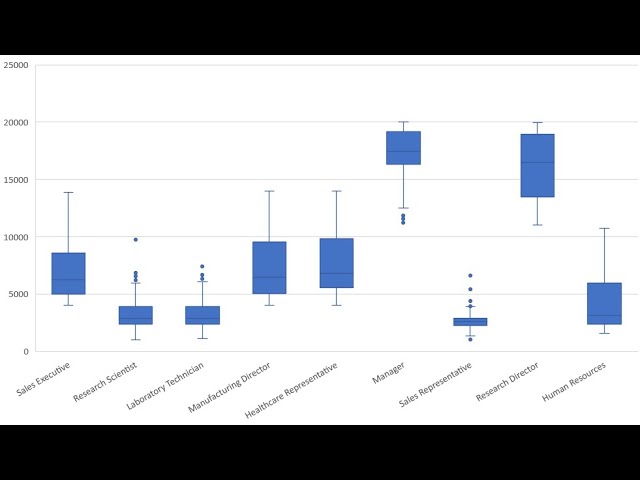
In this video I demonstrate how to create a boxplot using Microsoft Excel 365.
76,447 views
6 years ago
1,186,000 views
... excel so to do that let's jump on over to our main page here and first thing you're going to want to do is just open up the data file ...
284 views
5 years ago
592,063 views
Check out all my Full Courses on Analyst Builder: https://www.analystbuilder.com/ 25% Off Analyst Builder Code: BOOTCAMP In ...
973,922 views
SARA Institute was founded in April 2023 by Dr. Ajay Kumar Koli & Dr. Kiran Lata. How to Donate to SARA: UPI ID: ...
100 views
6 months ago
Power Map in Excel | Data Visualization with Excel Maps | How to Use 3D Map in Excel, you have the opportunity to captivate your ...
215 views
2 years ago
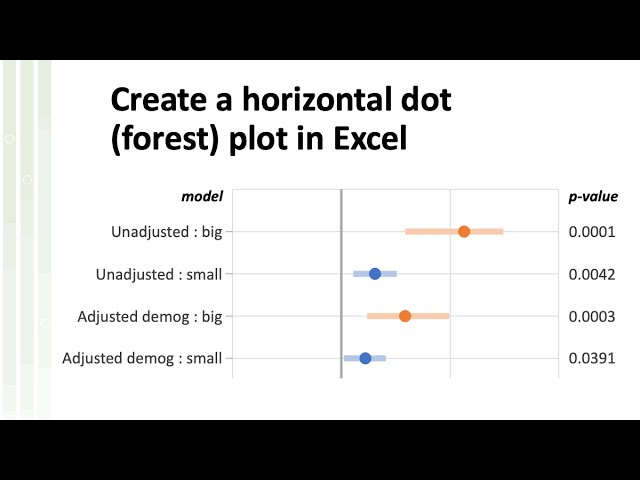
Horizontal bar charts are one of the Excel default plots, but what if you need the same arragement, but with symbols instead of ...
8,835 views
Unlock the power of visual communication and transform your raw Excel data into compelling, insightful charts with our ...
60 views
10 months ago
Join the Skool AI Community – blueprints, tutorials, tools & expert help to level up fast! https://bit.ly/454oVuE Links ...
10,765 views
7 months ago
Check out my Full Tableau Course Here: https://www.analystbuilder.com/courses/tableau-for-data-visualization This is our first of ...
970,752 views
This video covers basics of working with big data in excel including: Split Panes, GoTo, shift vs. control for selecting cells, and ...
3,112 views
11 years ago
61 views


![Ultimate Data Analyst Bootcamp [24 Hours!] for FREE | SQL, Excel, Tableau, Power BI, Python, Azure](/api/proxy/image?url=https%3A%2F%2Fi.ytimg.com%2Fvi%2FwQQR60KtnFY%2Fsddefault.jpg)