Upload date
All time
Last hour
Today
This week
This month
This year
Type
All
Video
Channel
Playlist
Movie
Duration
Short (< 4 minutes)
Medium (4-20 minutes)
Long (> 20 minutes)
Sort by
Relevance
Rating
View count
Features
HD
Subtitles/CC
Creative Commons
3D
Live
4K
360°
VR180
HDR
442 results
Making high-quality data visualizations can take hours - but it doesn't have to. We'll walk through a clean, efficient workflow for ...
188 views
3 months ago
In this video, we'll explore how to use the `imshow` function in Python's Matplotlib library to display a single color image. Whether ...
4 views
10 months ago
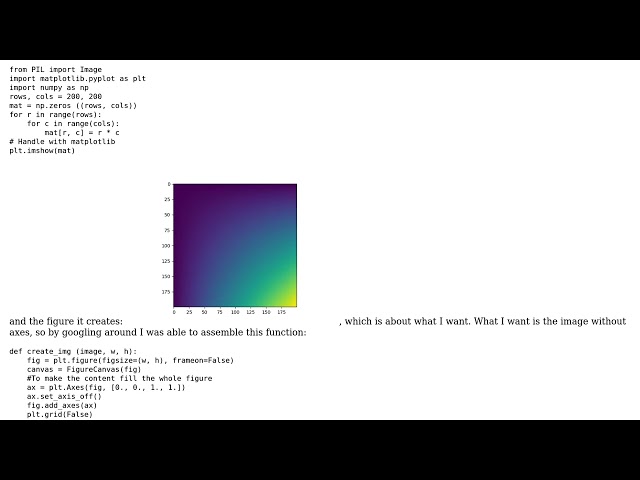
How to have matplotlib's imshow generate an image without being plotted? Helpful? Please use the *Thanks* button above!
10 views
4 months ago
In this video, we dive into the essential techniques for managing memory when using Matplotlib in Python. As data visualization ...
5 views
7 months ago
In this video, we dive into the common pitfalls and errors encountered when using Matplotlib in a multiprocessing environment.
8 views
8 months ago
In this video, we delve into the intricacies of aligning ticks when using Matplotlib's twin axes feature. If you've ever struggled with ...
6 views
6 months ago
Welcome to Let's Talk About Data! In this video, Sonu Singh guides you through the essential Python libraries for data science: ...
279 views
In this video, we'll explore the process of adding a legend to your Matplotlib visualizations, specifically focusing on how to ...
9 views
9 months ago
In this video, we tackle a common issue faced by many data visualizers: text being chopped off when saving plots with Matplotlib.
1 view
In this video, we'll explore the fascinating world of data visualization using Matplotlib, focusing specifically on how to fill a polygon ...
3 views
How can I have a matplotlib legend span the plot areas of the subplots? I hope you found a solution that worked for you :) The ...
0 views
In this video, we dive into the essential components of Matplotlib, one of the most popular plotting libraries in Python. We'll clarify ...
In this video, we'll explore how to enhance your data visualizations by adding percentage labels to stacked barplots using ...
1 month ago
In this video, we dive into the common challenges faced when working with Matplotlib animations in Python. If you've ever ...
31 views
In this video, we dive into the exciting world of dynamic plotting using Matplotlib's animation capabilities. Whether you're a data ...
CSS (Cascading Style Sheets) is used in web development to style HTML elements, control layouts, colors, and responsiveness, ...
17 views
In this video, we delve into the powerful combination of Matplotlib and QML, showcasing how to seamlessly integrate dynamic ...
11 months ago
In this video, we'll explore the world of Matplotlib styles, a powerful feature that can enhance your data visualizations. Whether ...
Today's Topic: Matplotlib's autoscale doesn't seem to work on y axis for small values? Thanks for taking the time to learn more.
4 days ago