Upload date
All time
Last hour
Today
This week
This month
This year
Type
All
Video
Channel
Playlist
Movie
Duration
Short (< 4 minutes)
Medium (4-20 minutes)
Long (> 20 minutes)
Sort by
Relevance
Rating
View count
Features
HD
Subtitles/CC
Creative Commons
3D
Live
4K
360°
VR180
HDR
129,344 results
If you're still using console.log() to find and fix JavaScript issues, you might be spending more time debugging than you need to.
901,047 views
8 years ago
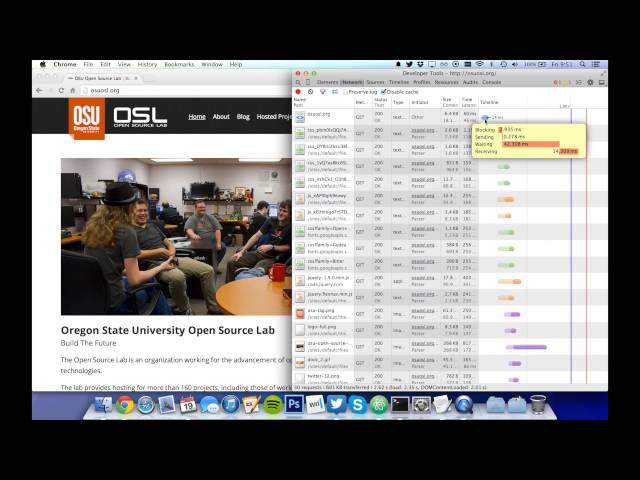
By Oregon State University Open Source Lab Student Sysadmin Jeffrey Borcean.
16,208 views
11 years ago
Barry joins Jecelyn again to explain how to record a trace in the Performance panel and debug LCP and CLS issues using the ...
29,369 views
1 year ago
Learn how to use the most popular Chrome DevTools features related to inspecting network activity, including: 1:05 - View a ...
396,478 views
6 years ago
Enhance your development experience with the exciting updates in Chrome DevTools 142-144. This video demonstrates Code ...
11,390 views
1 month ago
Discover 5 different ways to debug your code beyond console.log - Discover the breakpoints, debugger statements, logpoints, ...
43,493 views
2 years ago
In this video, Jecelyn will walk you through the basics of getting started and tips for Chrome DevTools. Chapters: 0:00 ...
110,000 views
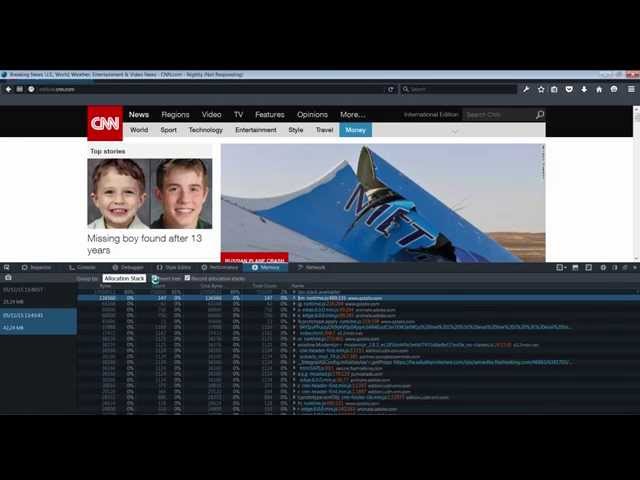
Baptiste Kaenel demonstrates Firefox's new Memory tool, which measures and analyzes heap allocations in web apps.
32,507 views
10 years ago
Explore advanced Network panel techniques, including how to find performance bottlenecks, debug popups, configure network ...
17,251 views
10 months ago
Learn how to record, replay and audit user flows with the Recorder panel in DevTools. Chapters: 0:00 - Intro 0:17 - Start a new ...
152,031 views
4 years ago
Interaction to Next Paint (INP) can be a daunting metric to start improving. It's common to know a page has a responsiveness ...
24,017 views
Performance debugging just got a whole lot easier. Learn how our new Chrome DevTools Performance panel is more accessible ...
17,813 views
7 months ago
Learn how to use the Performance insights panel to get actionable and use-case-driven insights on your website's performance.
53,341 views
3 years ago
Enroll in this course for FREE - get additional lessons, written content, interactive exercises, and more: learn.kevinpowell.co Get ...
8,120 views
Barry shows Jecelyn the new Performance panel landing page featuring a live view of your local Core Web Vitals performance.
13,553 views
Learn about Chrome Developer Tools. We'll have a detail look at what different options exist for developer to troubleshoot their ...
532 views
Let's take a guess - how many ways are there to open Chrome DevTools? Tell us your favorite ways in the comments below!
175,560 views
Want to test your websites on different mobile devices without owning a real one? In this episode, Jecelyn walks you through 5 ...
123,033 views
In this video, let's dive into the different types of browser cache and how to inspect and manage them in Chrome DevTools!
27,577 views
To watch this keynote interpreted in American Sign Language (ASL), please click here → https://goo.gle/3LYclAp Learn how new ...
30,306 views