Upload date
All time
Last hour
Today
This week
This month
This year
Type
All
Video
Channel
Playlist
Movie
Duration
Short (< 4 minutes)
Medium (4-20 minutes)
Long (> 20 minutes)
Sort by
Relevance
Rating
View count
Features
HD
Subtitles/CC
Creative Commons
3D
Live
4K
360°
VR180
HDR
3,439 results
If you're still using console.log() to find and fix JavaScript issues, you might be spending more time debugging than you need to.
902,378 views
8 years ago
Developers use frameworks, multiple languages, and libraries to build their web applications. Browsers only see the resulting ...
10,679 views
2 years ago
To watch this keynote interpreted in American Sign Language (ASL), please click here → https://goo.gle/3LYclAp Learn how new ...
30,533 views
3 years ago
You can find the lecture notes and exercises for this lecture at https://missing.csail.mit.edu/2026/debugging-profiling/ 0:00:00 ...
3,634 views
7 days ago
Performance debugging just got a whole lot easier. Learn how our new Chrome DevTools Performance panel is more accessible ...
18,438 views
8 months ago
Optimizers often push systems to their limits of multidisciplinary analysis, so sometimes solvers don't converge. You can follow a ...
853 views
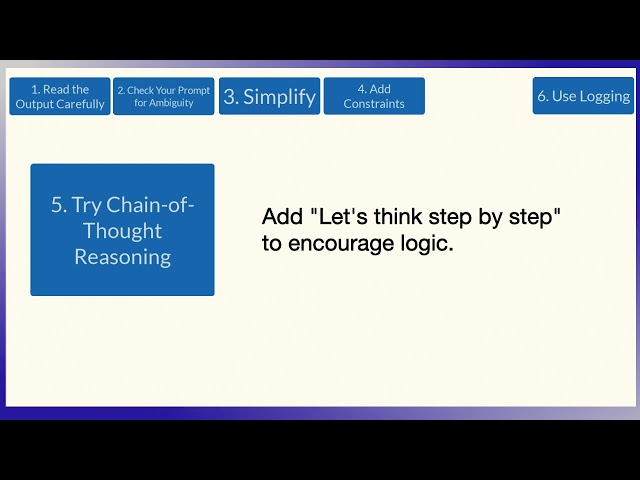
In this video, we'll walk through a practical debugging workflow. Debugging prompts is like debugging code. Here's a step-by-step ...
72 views
6 months ago
We provide a conceptual over of debugging. How to actually debug Java programs using Eclipse will be discussed in later videos ...
4,566 views
9 years ago
Jake and Surma tackle one of the hardest types of debugging on the web: Memory leaks. Some links mentioned: Squoosh ...
51,413 views
4 years ago
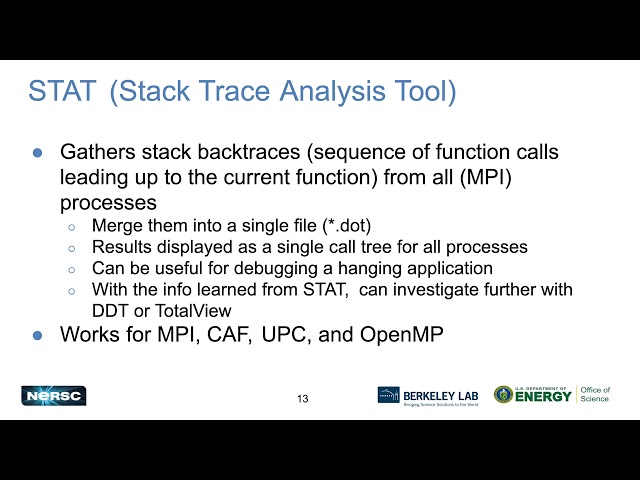
Part of the NERSC New User Training on June 16, 2020. Please see ...
202 views
5 years ago
It is less about squashing bugs but more about answering the question "what happened" that a nasty product manager or ...
2,897 views
https://media.ccc.de/v/ASG2018-213-a_debugger_from_scratch At some stage in your programming life you may well have used ...
7,068 views
7 years ago
Part of the New User Training and Updated Best Practices on Perlmutter: February 15-16, 2024 Please see ...
94 views
1 year ago
Interaction to Next Paint (INP) is a Core Web Vital that measures how responsive a page is to interactions. Due to INP's scope, ...
7,735 views
And I'm going to talk about the debugging on GPU. So maybe I'm a civilian that underestimating the number of threads here, but I ...
2,084 views
You can find the lecture notes and exercises for this lecture at https://missing.csail.mit.edu/2020/debugging-profiling/ Help us ...
101,658 views
This video describes the context menus for debugging that can be triggered by holding Ctrl and right-clicking the WebSquare ...
196 views
You can watch this class without ads and with quizzes and lab setup instructions by going to https://ost2.fyi/Arch2001.
1,162 views
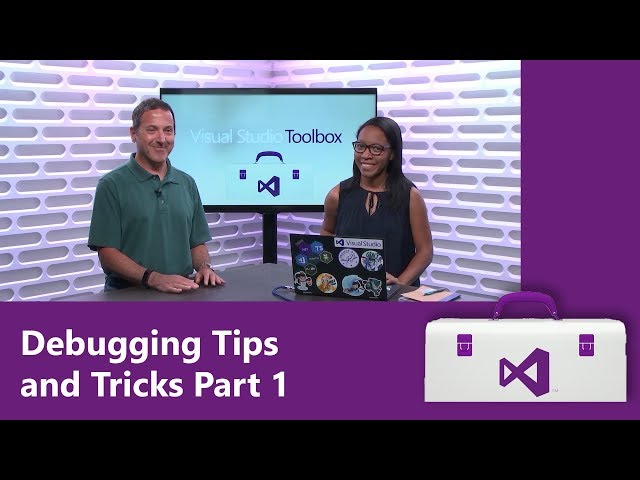
In this episode (part 1 of 2), Robert is joined by Leslie Richardson, who shows several ways you can get the most out of Visual ...
34,185 views
6 years ago
Optimization of complicated multidisciplinary systems is not easy. By following this systematic debugging procedure you can ...
1,649 views