Upload date
All time
Last hour
Today
This week
This month
This year
Type
All
Video
Channel
Playlist
Movie
Duration
Short (< 4 minutes)
Medium (4-20 minutes)
Long (> 20 minutes)
Sort by
Relevance
Rating
View count
Features
HD
Subtitles/CC
Creative Commons
3D
Live
4K
360°
VR180
HDR
137,426 results
In this video we talk about how we deal with the fact that the earth is a globe when making maps.
359 views
3 years ago
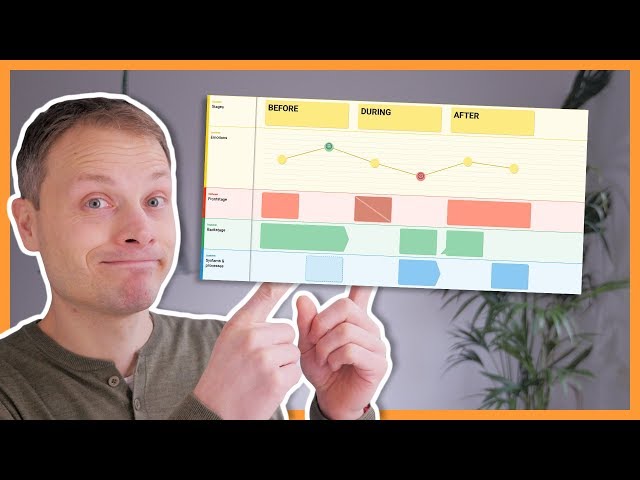
Customer Journey Maps are all over the place. They can be a great tool to structure research data, get valuable user insights and ...
52,710 views
7 years ago
FULL SHOW https://youtu.be/RNTvxHOO4A8 #UKRAINEVICTORY #RUSSIARETREAT Join this channel to get access to perks: ...
1,701 views
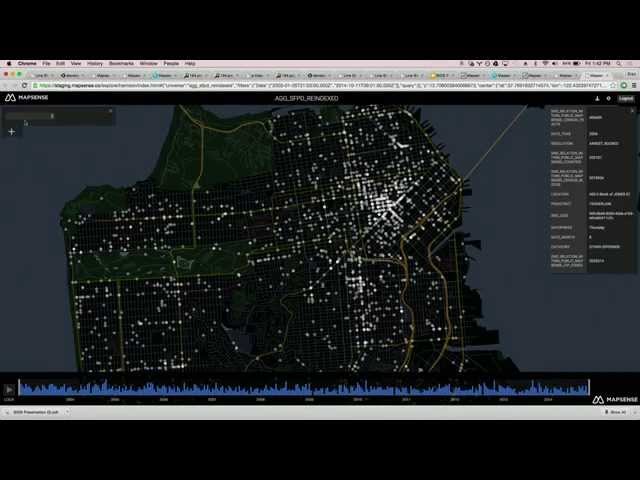
BIDS Data Science Lecture Series | February 13, 2015 | 1:00-2:30 p.m. | 190 Doe Library, UC Berkeley Speaker: Erez Cohen, ...
13,347 views
Streamed 10 years ago
Entering a rallying market can be tricky. You don't want to buy the top, but at the same time you have a strong bias and can't wait ...
346,439 views
2 years ago
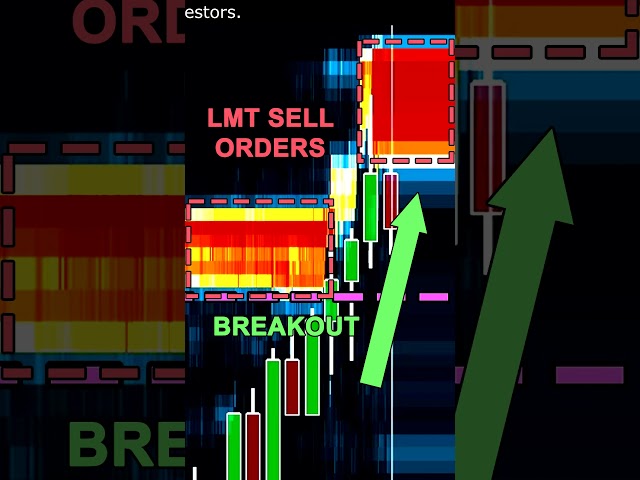
Use the liquidity heatmap to spot trapped trader scenarios unfold. Click here to get started with Bookmap for FREE: ...
99,965 views
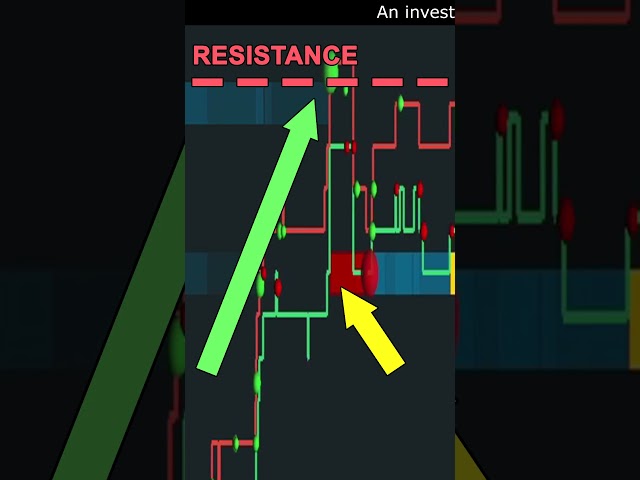
Learn to spot absorption to add confluence to your trades. Get started with Bookmap for FREE: https://bit.ly/3NDBR16 Follow ...
38,383 views
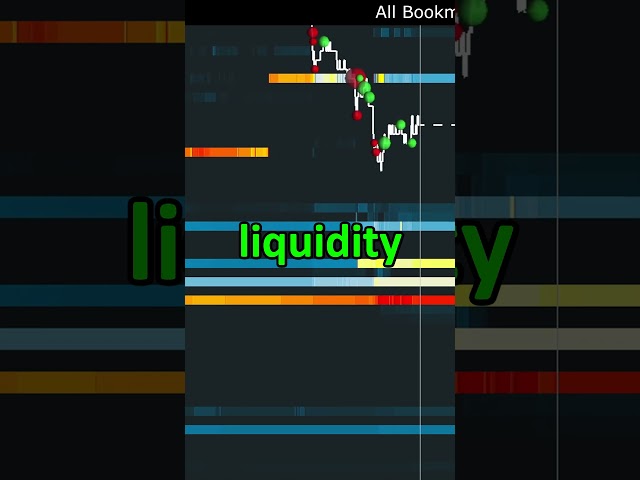
How the Bookmap heatmap is generated and the information it shows. A visualization of the historical liquidity within the order ...
93,324 views
Passive liquidity can be used to measure the momentum of a move. Try it for yourself - get Bookmap for FREE here: ...
93,110 views
Introduction to network analysis and visualization with GEPHI. Datasets and tutorial here: ...
107,905 views
In this comprehensive GIS tutorial, we'll move beyond basic mapping to answer a critical urban planning question: How ...
2,538 views
7 months ago
GIS: Difference between Heat Map and Hot Spot Analysis? Helpful? Please support me on Patreon: ...
45 views
4 years ago
The Data Analyst Roadmap on AnalystBuilder.com is one of the best resources to get up to speed and job ready. Link to Bundle: ...
61,515 views
1 year ago
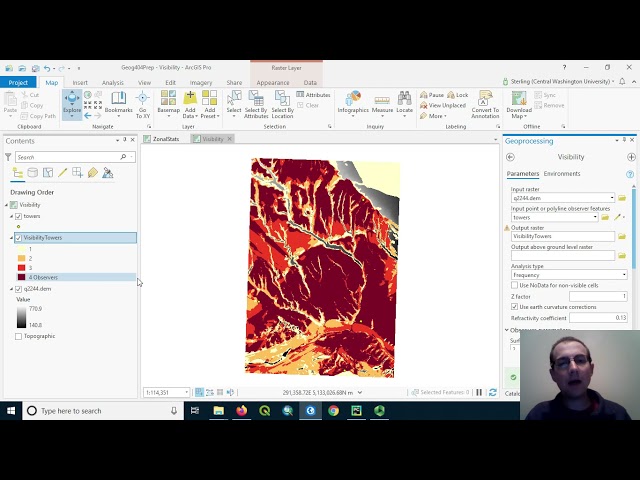
Dr. Sterling Quinn demonstrates how to perform a visibility analysis in ArcGIS Pro. This example identifies how many potential cell ...
11,796 views
Alexander Hendorf - Data Analysis and Map-Reduce with mongoDB and pymongo [EuroPython 2015] [22 July 2015] [Bilbao, ...
998 views
10 years ago
We answer the question, what is a liquidity heatmap? And what's heatmap trading? We also look at the advantages of using a ...
83,676 views
Dr. Sterling Quinn demonstrates how to perform a visibility analysis in QGIS. This scenario determines how many potential cell ...
3,569 views
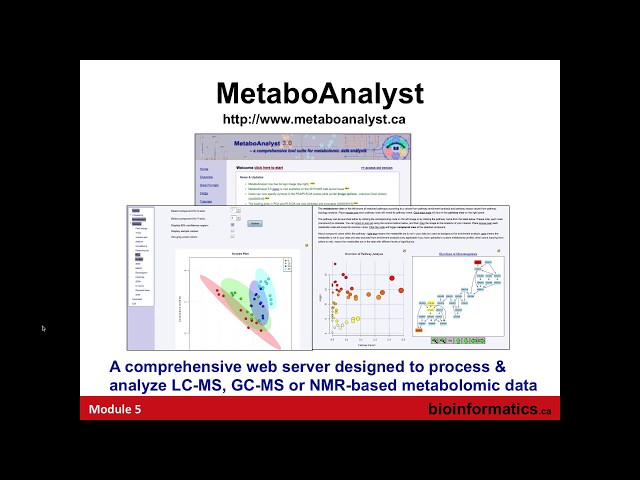
This is the fifth lecture in the Informatics and Statistics for Metabolomics 2017 workshop hosted by the Canadian Bioinformatics ...
69,068 views
8 years ago
In its most basic form a Customer Journey Map is a visual representation of the steps your customers goes though in your service ...
134,936 views
Do you want to trade successfully? Download ATAS for free with full functionality: https://web.atas.net/download_atas_en ✓ Also, ...
11,080 views
4 months ago