Upload date
All time
Last hour
Today
This week
This month
This year
Type
All
Video
Channel
Playlist
Movie
Duration
Short (< 4 minutes)
Medium (4-20 minutes)
Long (> 20 minutes)
Sort by
Relevance
Rating
View count
Features
HD
Subtitles/CC
Creative Commons
3D
Live
4K
360°
VR180
HDR
25 results
Today's Topic: Updating z data on a surface_plot in Matplotlib animation Thanks for taking the time to learn more. In this video I'll ...
0 views
10 days ago
Today's Topic: Make interactive matplotlib window not pop to front on each update (Windows 7) Thanks for taking the time to learn ...
8 days ago
matplotlib don't rescale image after removing axis and colorbar Helpful? Please use the *Thanks* button above! Or, thank me via ...
12 views
13 days ago
Today's Topic: Scatter plot label overlaps - matplotlib Thanks for taking the time to learn more. In this video I'll go through your ...
4 days ago
Today's Topic: Matplotlib's autoscale doesn't seem to work on y axis for small values? Thanks for taking the time to learn more.
1 view
2 days ago
Today's Topic: Matplotlib Make Center Circle Transparent Thanks for taking the time to learn more. In this video I'll go through your ...
19 hours ago
Updating aesthetics of matplotlib heatmap Helpful? Please use the *Thanks* button above! Or, thank me via Patreon: ...
40 views
2 weeks ago
Today's Topic: How to plot date data evenly along x-axis? Thanks for taking the time to learn more. In this video I'll go through your ...
12 days ago
Today's Topic: Scikit Learn - How to plot probabilities Thanks for taking the time to learn more. In this video I'll go through your ...
2 views
Matplotlib: animation for audio player cursor (sliding vertical line) with blitting looks broken on WxPython Helpful? Please use the ...
3 views
3 weeks ago
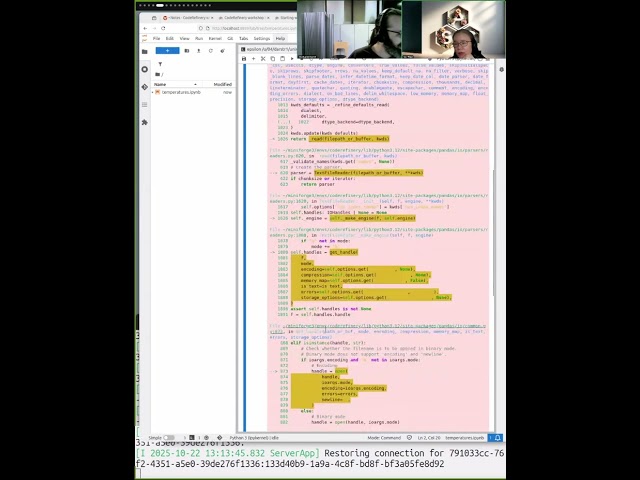
In this live-coding demo session we take a Python script as starting point which reads data, computes simple statistics, and ...
9 views
8 views
Streamed 2 weeks ago
22 views
Streamed 3 weeks ago
Today's Topic: Adding title to the column of subplot below suptitle Thanks for taking the time to learn more. In this video I'll go ...
How do I get date and time from two columns of a numpy array into a datetime format that can be used by matplotlib? Helpful?
47 views
7 days ago
Today's Topic: How to move the y axis scale factor to the position next to the y axis label? Thanks for taking the time to learn more.
Today's Topic: Python: "ModuleNotFoundError", but module is installed? Thanks for taking the time to learn more. In this video I'll ...
This video highlights why choosing the right color map is critical for scientific integrity. A poorly chosen palette can ...
1 day ago
How do I plot multiple series with different x-values in Pandas? Helpful? Please use the *Thanks* button above! Or, thank me via ...
32 views