Upload date
All time
Last hour
Today
This week
This month
This year
Type
All
Video
Channel
Playlist
Movie
Duration
Short (< 4 minutes)
Medium (4-20 minutes)
Long (> 20 minutes)
Sort by
Relevance
Rating
View count
Features
HD
Subtitles/CC
Creative Commons
3D
Live
4K
360°
VR180
HDR
213 results
By default, the build toolchain for #SharePoint Framework (#SPFx) projects that use #React isn't supported by the React DevTools ...
341 views
3 years ago
Conditional rendering issues in JSX, forwardRef, dozens of ways to create refs, render props (yeah they still exist), act, ...
282 views
Barry joins Jecelyn again to explain how to record a trace in the Performance panel and debug LCP and CLS issues using the ...
29,753 views
1 year ago
Performance debugging just got a whole lot easier. Learn how our new Chrome DevTools Performance panel is more accessible ...
18,093 views
8 months ago
I do reactions /reviews (of any genre) and interview tons of people from all over the globe! Welcome! - BG Give me Requests over ...
146 views
2 years ago
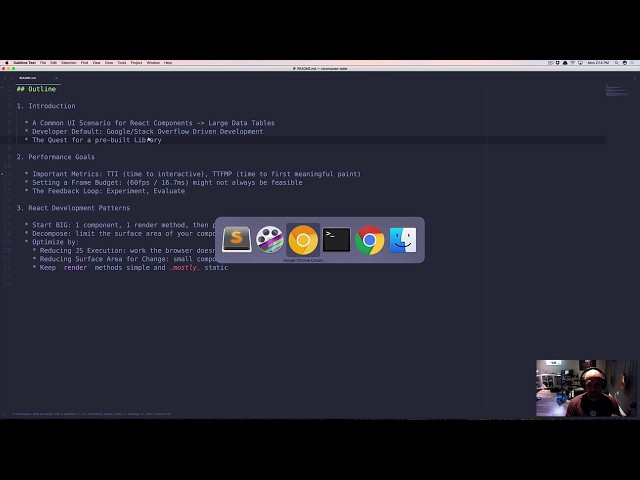
This screencast covers a number of techniques on constructing components, objectively evaluating performance, and making ...
829 views
8 years ago
This talk shares our experience of performance optimizing our React App. The objective of the presentation is to talk about how ...
2,216 views
6 years ago
Never lose your place in the Performance panel timeline again. Zoom in and set a breadcrumb to clamp the boundaries of the ...
7,538 views
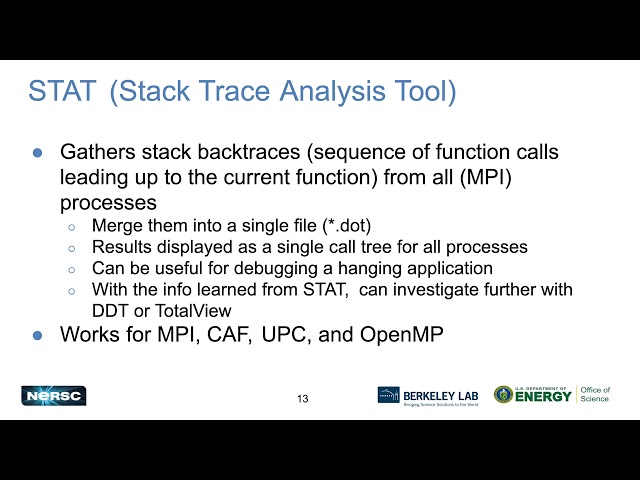
Part of the NERSC New User Training on June 16, 2020. Please see ...
201 views
5 years ago
Do you have a bottleneck in your React application? If so, we're going to discuss the best ways to find and solve it based on the ...
15 views
Streamed 4 years ago
Colonel Russell Williams Interview and Interrogation was performed by Jim Smyth. What do four of the world's top body language, ...
557,215 views
4 years ago
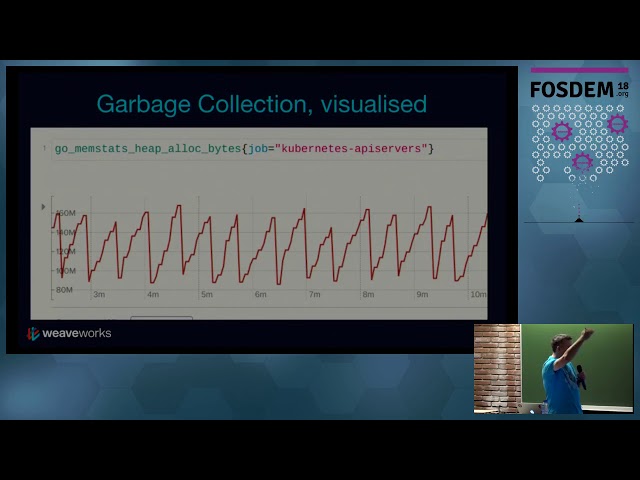
by Bryan Boreham At: FOSDEM 2018 Room: H.1308 (Rolin) Scheduled start: 2018-02-03 16:30:00+01.
13,852 views
7 years ago
When we talk about a 'fast' service we often don't mean one that can process 500MB/s per core, but one that can respond in less ...
3,986 views
Chrome DevTools: a suite of tools to debug and profile the performance of your site. They're bundled with every copy of Chrome, ...
42 views
In part 3 of our multi-part series on performance profiling, PM Esteban Herrera shows us how to profile apps once they are in ...
9,786 views
In this short, we will learn how to prevent re-renders in React and React Native. #reactnative #react #rerender #crossplatform.
502 views
If you're still using console.log() to find and fix JavaScript issues, you might be spending more time debugging than you need to.
901,608 views
react #neoscms #neoscon.
142 views
Jake and Surma tackle one of the hardest types of debugging on the web: Memory leaks. Some links mentioned: Squoosh ...
51,370 views
Check out Supabase: https://supabase.plug.dev/qnxeTMY ❤️ Get 40% OFF CodeCrafters: ...
169,649 views
3 months ago


![[Shorts for Devs] Avoid React Re-Render](/api/proxy/image?url=https%3A%2F%2Fi.ytimg.com%2Fvi%2FWxfFeZKtejE%2Fsddefault.jpg)