Upload date
All time
Last hour
Today
This week
This month
This year
Type
All
Video
Channel
Playlist
Movie
Duration
Short (< 4 minutes)
Medium (4-20 minutes)
Long (> 20 minutes)
Sort by
Relevance
Rating
View count
Features
HD
Subtitles/CC
Creative Commons
3D
Live
4K
360°
VR180
HDR
3,437 results
If you're still using console.log() to find and fix JavaScript issues, you might be spending more time debugging than you need to.
902,378 views
8 years ago
Developers use frameworks, multiple languages, and libraries to build their web applications. Browsers only see the resulting ...
10,679 views
2 years ago
You can find the lecture notes and exercises for this lecture at https://missing.csail.mit.edu/2026/debugging-profiling/ 0:00:00 ...
3,641 views
7 days ago
To watch this keynote interpreted in American Sign Language (ASL), please click here → https://goo.gle/3LYclAp Learn how new ...
30,533 views
3 years ago
Performance debugging just got a whole lot easier. Learn how our new Chrome DevTools Performance panel is more accessible ...
18,438 views
8 months ago
Optimizers often push systems to their limits of multidisciplinary analysis, so sometimes solvers don't converge. You can follow a ...
853 views
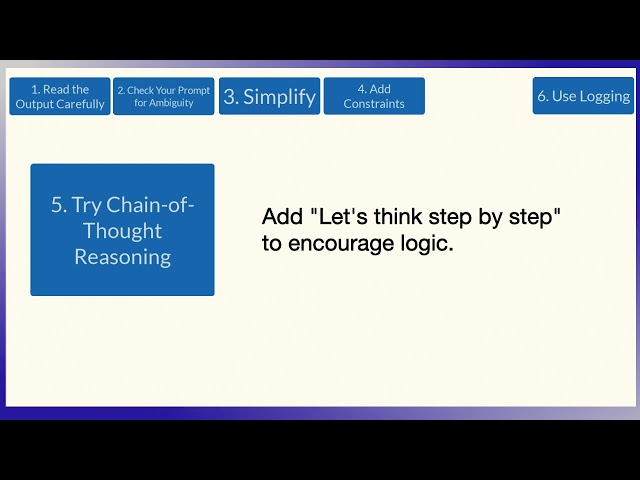
In this video, we'll walk through a practical debugging workflow. Debugging prompts is like debugging code. Here's a step-by-step ...
72 views
6 months ago
Jake and Surma tackle one of the hardest types of debugging on the web: Memory leaks. Some links mentioned: Squoosh ...
51,414 views
4 years ago
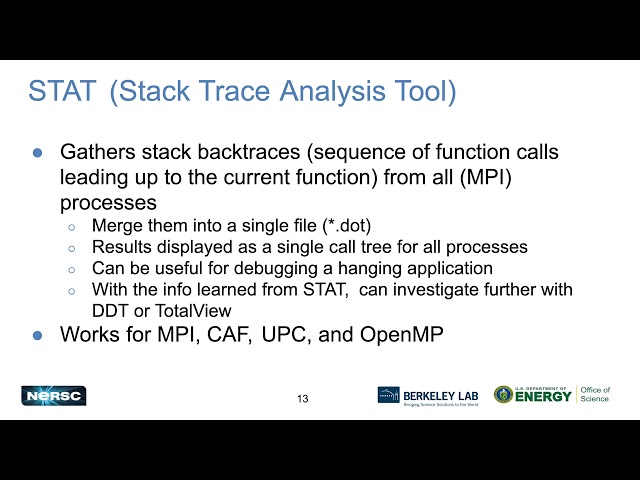
Part of the NERSC New User Training on June 16, 2020. Please see ...
202 views
5 years ago
We provide a conceptual over of debugging. How to actually debug Java programs using Eclipse will be discussed in later videos ...
4,566 views
9 years ago
Part of the New User Training and Updated Best Practices on Perlmutter: February 15-16, 2024 Please see ...
94 views
1 year ago
It is less about squashing bugs but more about answering the question "what happened" that a nasty product manager or ...
2,897 views
https://media.ccc.de/v/ASG2018-213-a_debugger_from_scratch At some stage in your programming life you may well have used ...
7,068 views
7 years ago
And I'm going to talk about the debugging on GPU. So maybe I'm a civilian that underestimating the number of threads here, but I ...
2,084 views
Interaction to Next Paint (INP) is a Core Web Vital that measures how responsive a page is to interactions. Due to INP's scope, ...
7,735 views
You can find the lecture notes and exercises for this lecture at https://missing.csail.mit.edu/2020/debugging-profiling/ Help us ...
101,658 views
6 years ago
In this episode (part 1 of 2), Robert is joined by Leslie Richardson, who shows several ways you can get the most out of Visual ...
34,185 views
You can watch this class without ads and with quizzes and lab setup instructions by going to https://ost2.fyi/Arch2001.
1,162 views
Optimization of complicated multidisciplinary systems is not easy. By following this systematic debugging procedure you can ...
1,649 views
This video describes the context menus for debugging that can be triggered by holding Ctrl and right-clicking the WebSquare ...
196 views