Upload date
All time
Last hour
Today
This week
This month
This year
Type
All
Video
Channel
Playlist
Movie
Duration
Short (< 4 minutes)
Medium (4-20 minutes)
Long (> 20 minutes)
Sort by
Relevance
Rating
View count
Features
HD
Subtitles/CC
Creative Commons
3D
Live
4K
360°
VR180
HDR
15,280 results
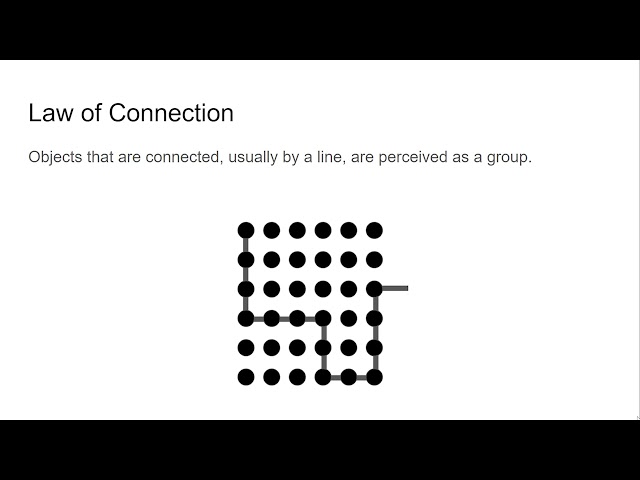
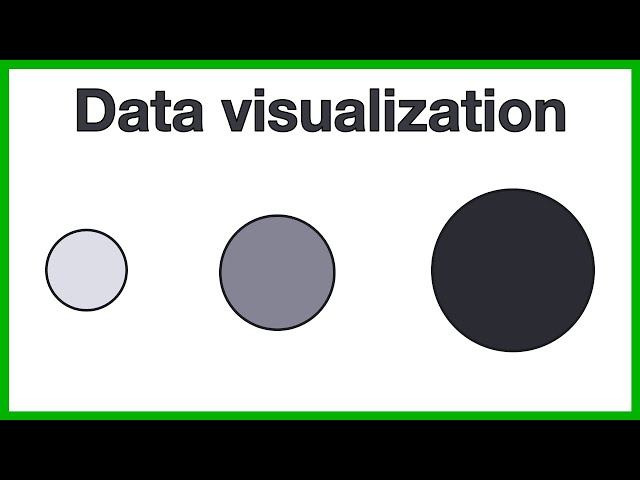
Presented by David Christensen. This video is part of a series of lectures recorded to teach about basic data visualization ...
158 views
4 years ago
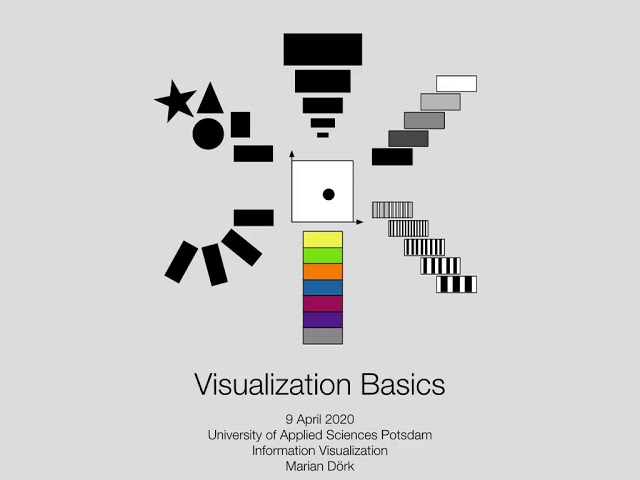
Every day we perceive many visual impressions. We can differentiate a multitude of colors in a bunch of flowers, and we can ...
204,539 views
9 years ago
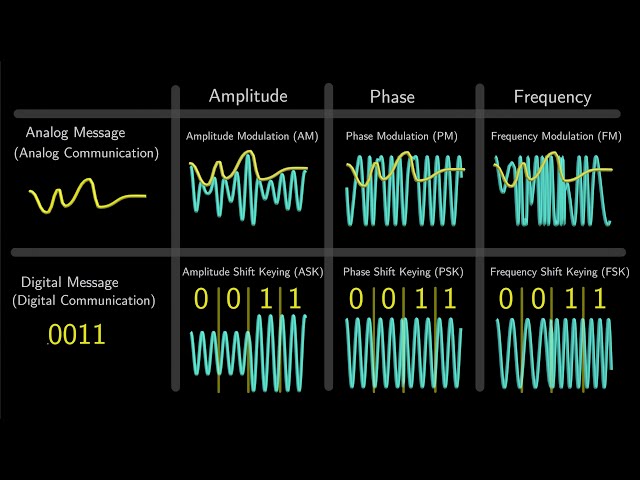
In this video, I explain how messages are transmitted over electromagnetic waves by altering their properties—a process known ...
228,024 views
1 year ago
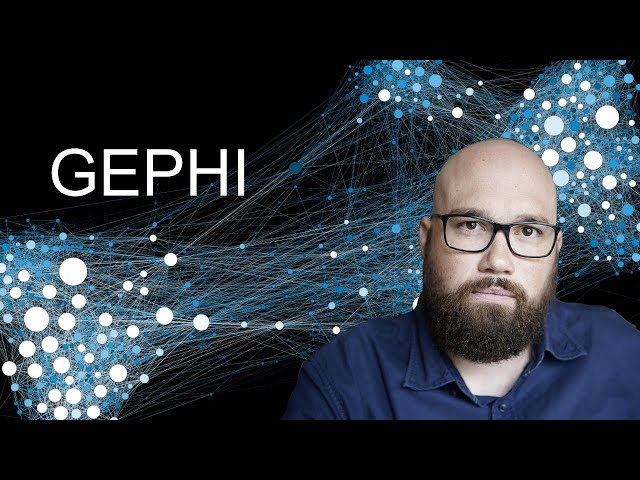
Introduction to network analysis and visualization with GEPHI. Datasets and tutorial here: ...
109,418 views
3 years ago
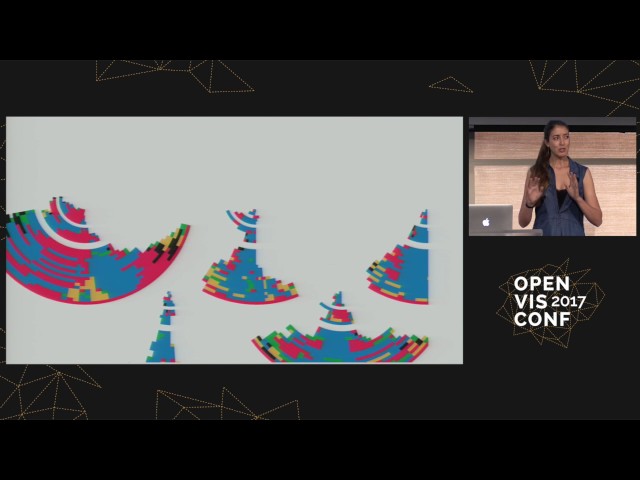
Or even better, a different data source. So many people dive straight from data to final visual. But take some time and actually sit ...
7,314 views
8 years ago
310 views
Making frequency tables, bar graphs, histograms, and pie charts. Also interpreting the graphs.
1,064 views
6 years ago
A short introduction to the core concepts of data visualization and their application to network biology. The presentation provides a ...
4,550 views
In visual analysis, I'm answering four different questions. Are the data divided? Are they stable? Am I convinced by the data?
4,500 views
5 years ago
Let's talk about Data Visualization! We've been hearing this expression a lot lately, but do you really know how to put your data in ...
179 views
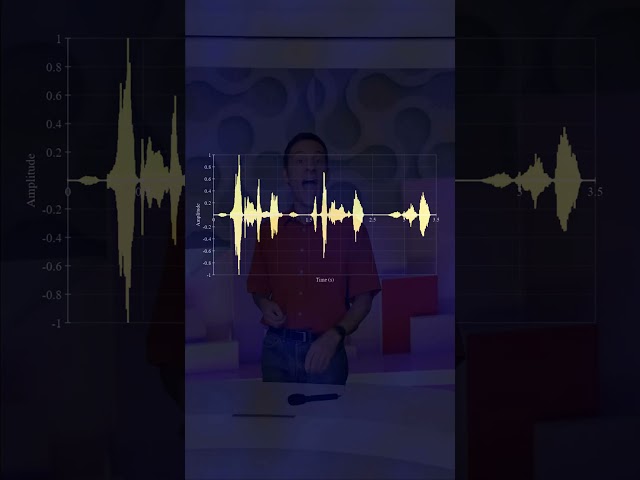
Convolution plays a pivotal role in signal processing, allowing us to extract valuable information and uncover hidden patterns in ...
66,050 views
2 years ago
Florence Nightingale's Diagram of the causes of mortality in the army in the East, 1858 – derivation of piechart, seasonal ...
116 views
Full video: https://www.youtube.com/watch?v=c3eMoHuPRy0 Learn how modulation embeds messages onto electromagnetic ...
64,726 views
8 months ago
Dr Helen Kara, NCRM visiting fellow, in the first (of three) part of the 'Creative Research Methods' NCRM online course.
56,772 views
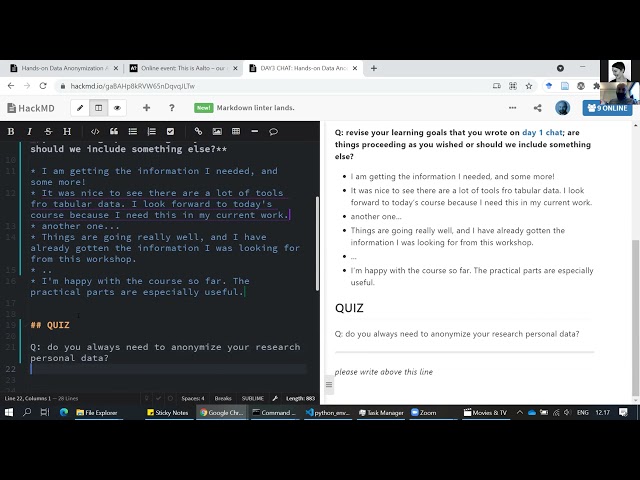
Hands-on Data Anonymization workshop, April 2021, Aalto University. Course material: ...
122 views
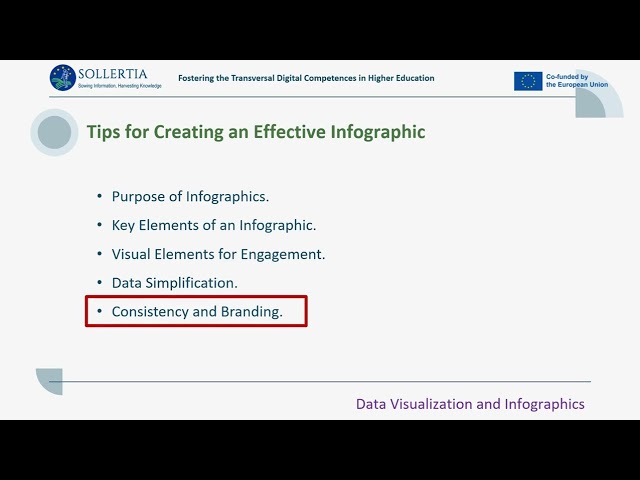
In this lesson, we will explore three essential aspects of creating effective visual representations of data. We'll begin by discussing ...
13 views
In this video, we break down the concept of OFDM (Orthogonal Frequency Division Multiplexing)—a key technology behind Wi-Fi, ...
44,902 views
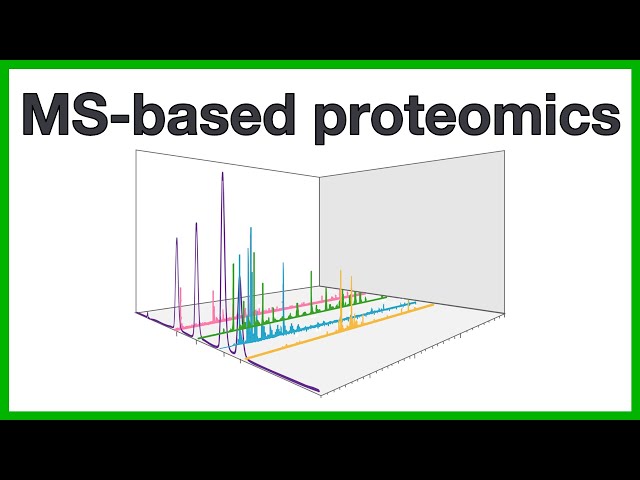
A short introduction to the core concepts of MS-based proteomics, which is the use of mass spectrometry to simultaneously ...
47,669 views
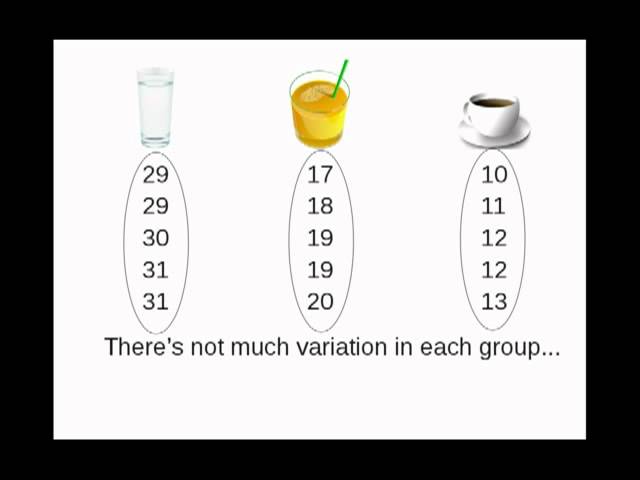
A description of the concepts behind Analysis of Variance. There is an interactive visualization here: ...
1,326,062 views
14 years ago
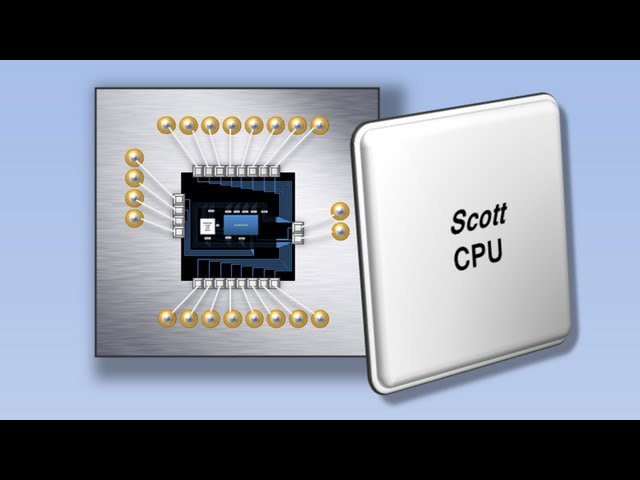
Learn how the most important component in your device works, right here! Author's Website: http://www.buthowdoitknow.com/ See ...
8,475,467 views
12 years ago