Upload date
All time
Last hour
Today
This week
This month
This year
Type
All
Video
Channel
Playlist
Movie
Duration
Short (< 4 minutes)
Medium (4-20 minutes)
Long (> 20 minutes)
Sort by
Relevance
Rating
View count
Features
HD
Subtitles/CC
Creative Commons
3D
Live
4K
360°
VR180
HDR
2,588 results
376 views
5 years ago
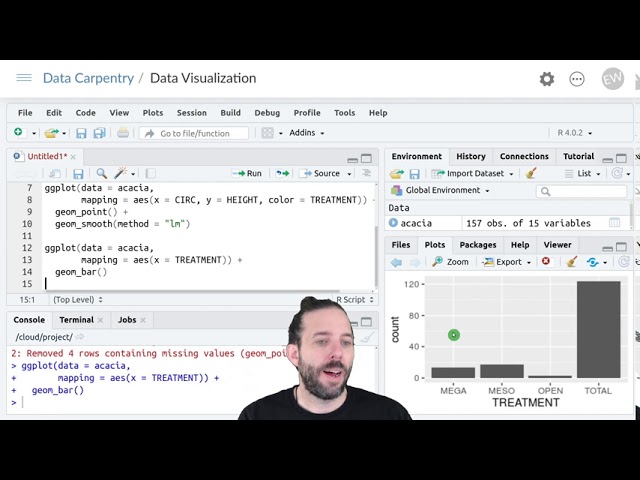
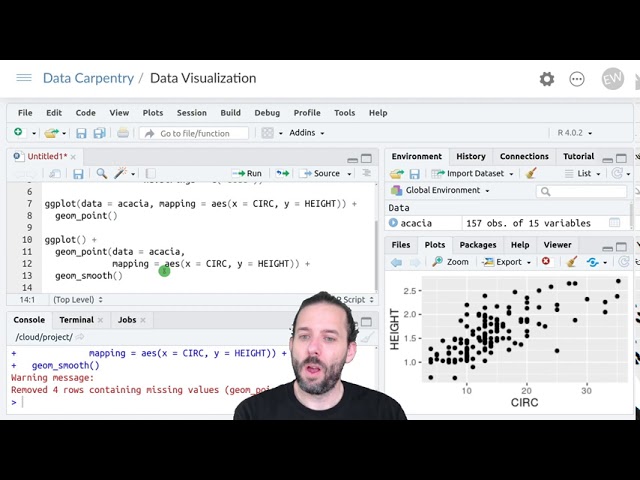
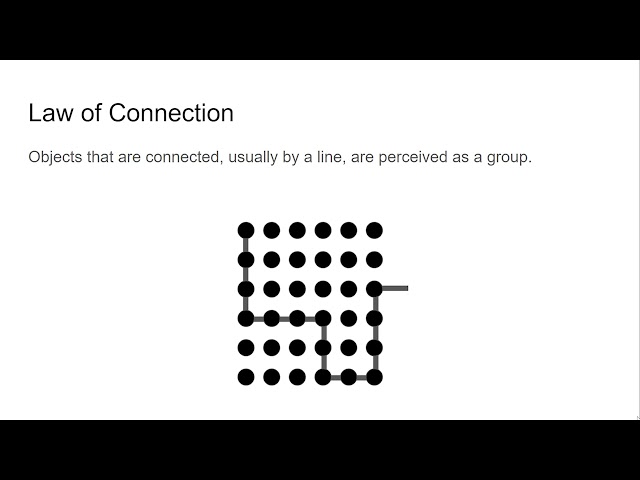
Presented by Alisa Rod. This video is part of a series of lectures recorded to teach about basic data visualization concepts.
354 views
4 years ago
A short film describing the development of a prototype application for the Oculus Rift DK2 headset, to visualise subsurface ...
8,075 views
11 years ago
Hello everyone! In todays video I want to show you how you can use Obsidian for data visualization by using Obsidian Charts, ...
26,832 views
2 years ago
591 views
Presented by Tess Grynoch. This video is part of a series of lectures recorded to teach about basic data visualization concepts.
29 views
Presented by David Christensen. This video is part of a series of lectures recorded to teach about basic data visualization ...
318 views
Presented by Angela Zoss. This video is part of a series of lectures recorded to teach about basic data visualization concepts.
105 views
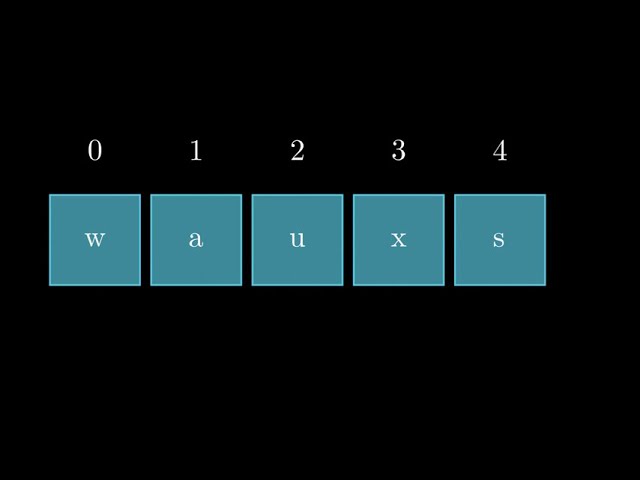
Hello, My name is Mr. Nobody. Today's video is an experiment for visualizing arrays using Manim. # Tools ...
698 views
3 years ago
170 views
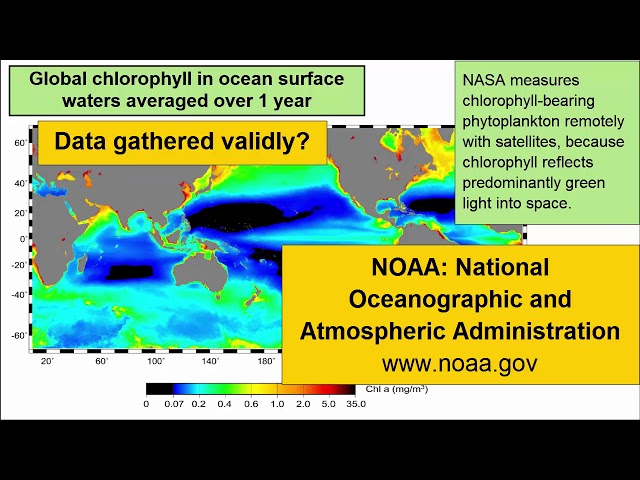
For an introductory college-level earth sciences class: a review of how to read and critically evaluate data visualizations such as ...
9,104 views
8 years ago
A short introduction to the core concepts of data visualization and their application to network biology. The presentation provides a ...
4,678 views
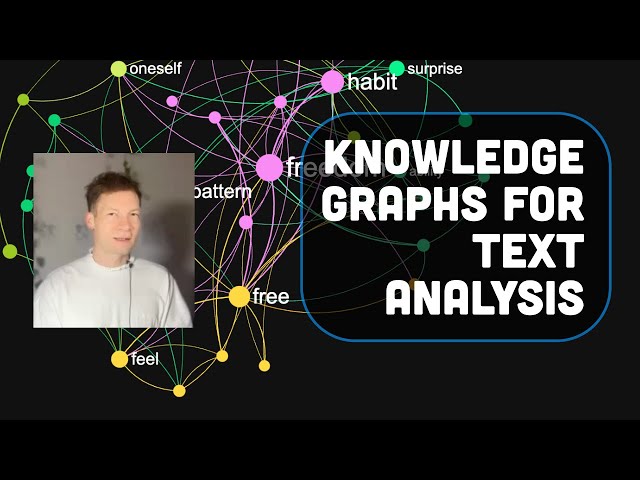
In this video, I will demonstrate how to use https://infranodus.com for text data visualization and analysis with AI. I will show how ...
2,431 views
1 year ago
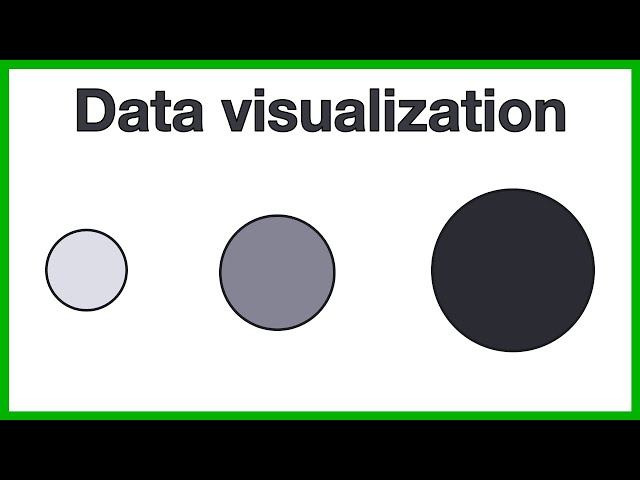
Let's talk about Data Visualization! We've been hearing this expression a lot lately, but do you really know how to put your data in ...
180 views
102 views
Researching Educational Technologies: Consensus Analysis.
4 views
Learn about the Data Science Pipeline with the National Student Data Corps! The fifth step in the Data Science Pipeline is Data ...
235 views
In this tutorial, we guide you through creating and customizing visualization blocks in workbooks. Starting with a new workbook ...
33 views
Want to create amazing health visualizations that actually make a difference? Adriana Arcia and her research team have put ...
496 views
This video is part of the #dariahTeach platform (http://teach.dariah.eu), an open-source, community-driven platform for high quality ...
1,816 views
9 years ago